Enumeration was completed in 72 out of 96 initial sampled blocks.
18 of the 72 initial sampled blocks enumerated resulted in expansion to adjacent blocks
184 blocks (including both initial sampled and expansion blocks) were enumerated.
In total, 4460 business were found during enumeration
Of all businesses, 2,887 (65%) were eligible for the study
Of eligible businesses, 905 (31%) were selected at random for interview
Of selected businesses, 812 (90%) were successfully interviewed
Successful interviews originate from 20 initial sampled blocks
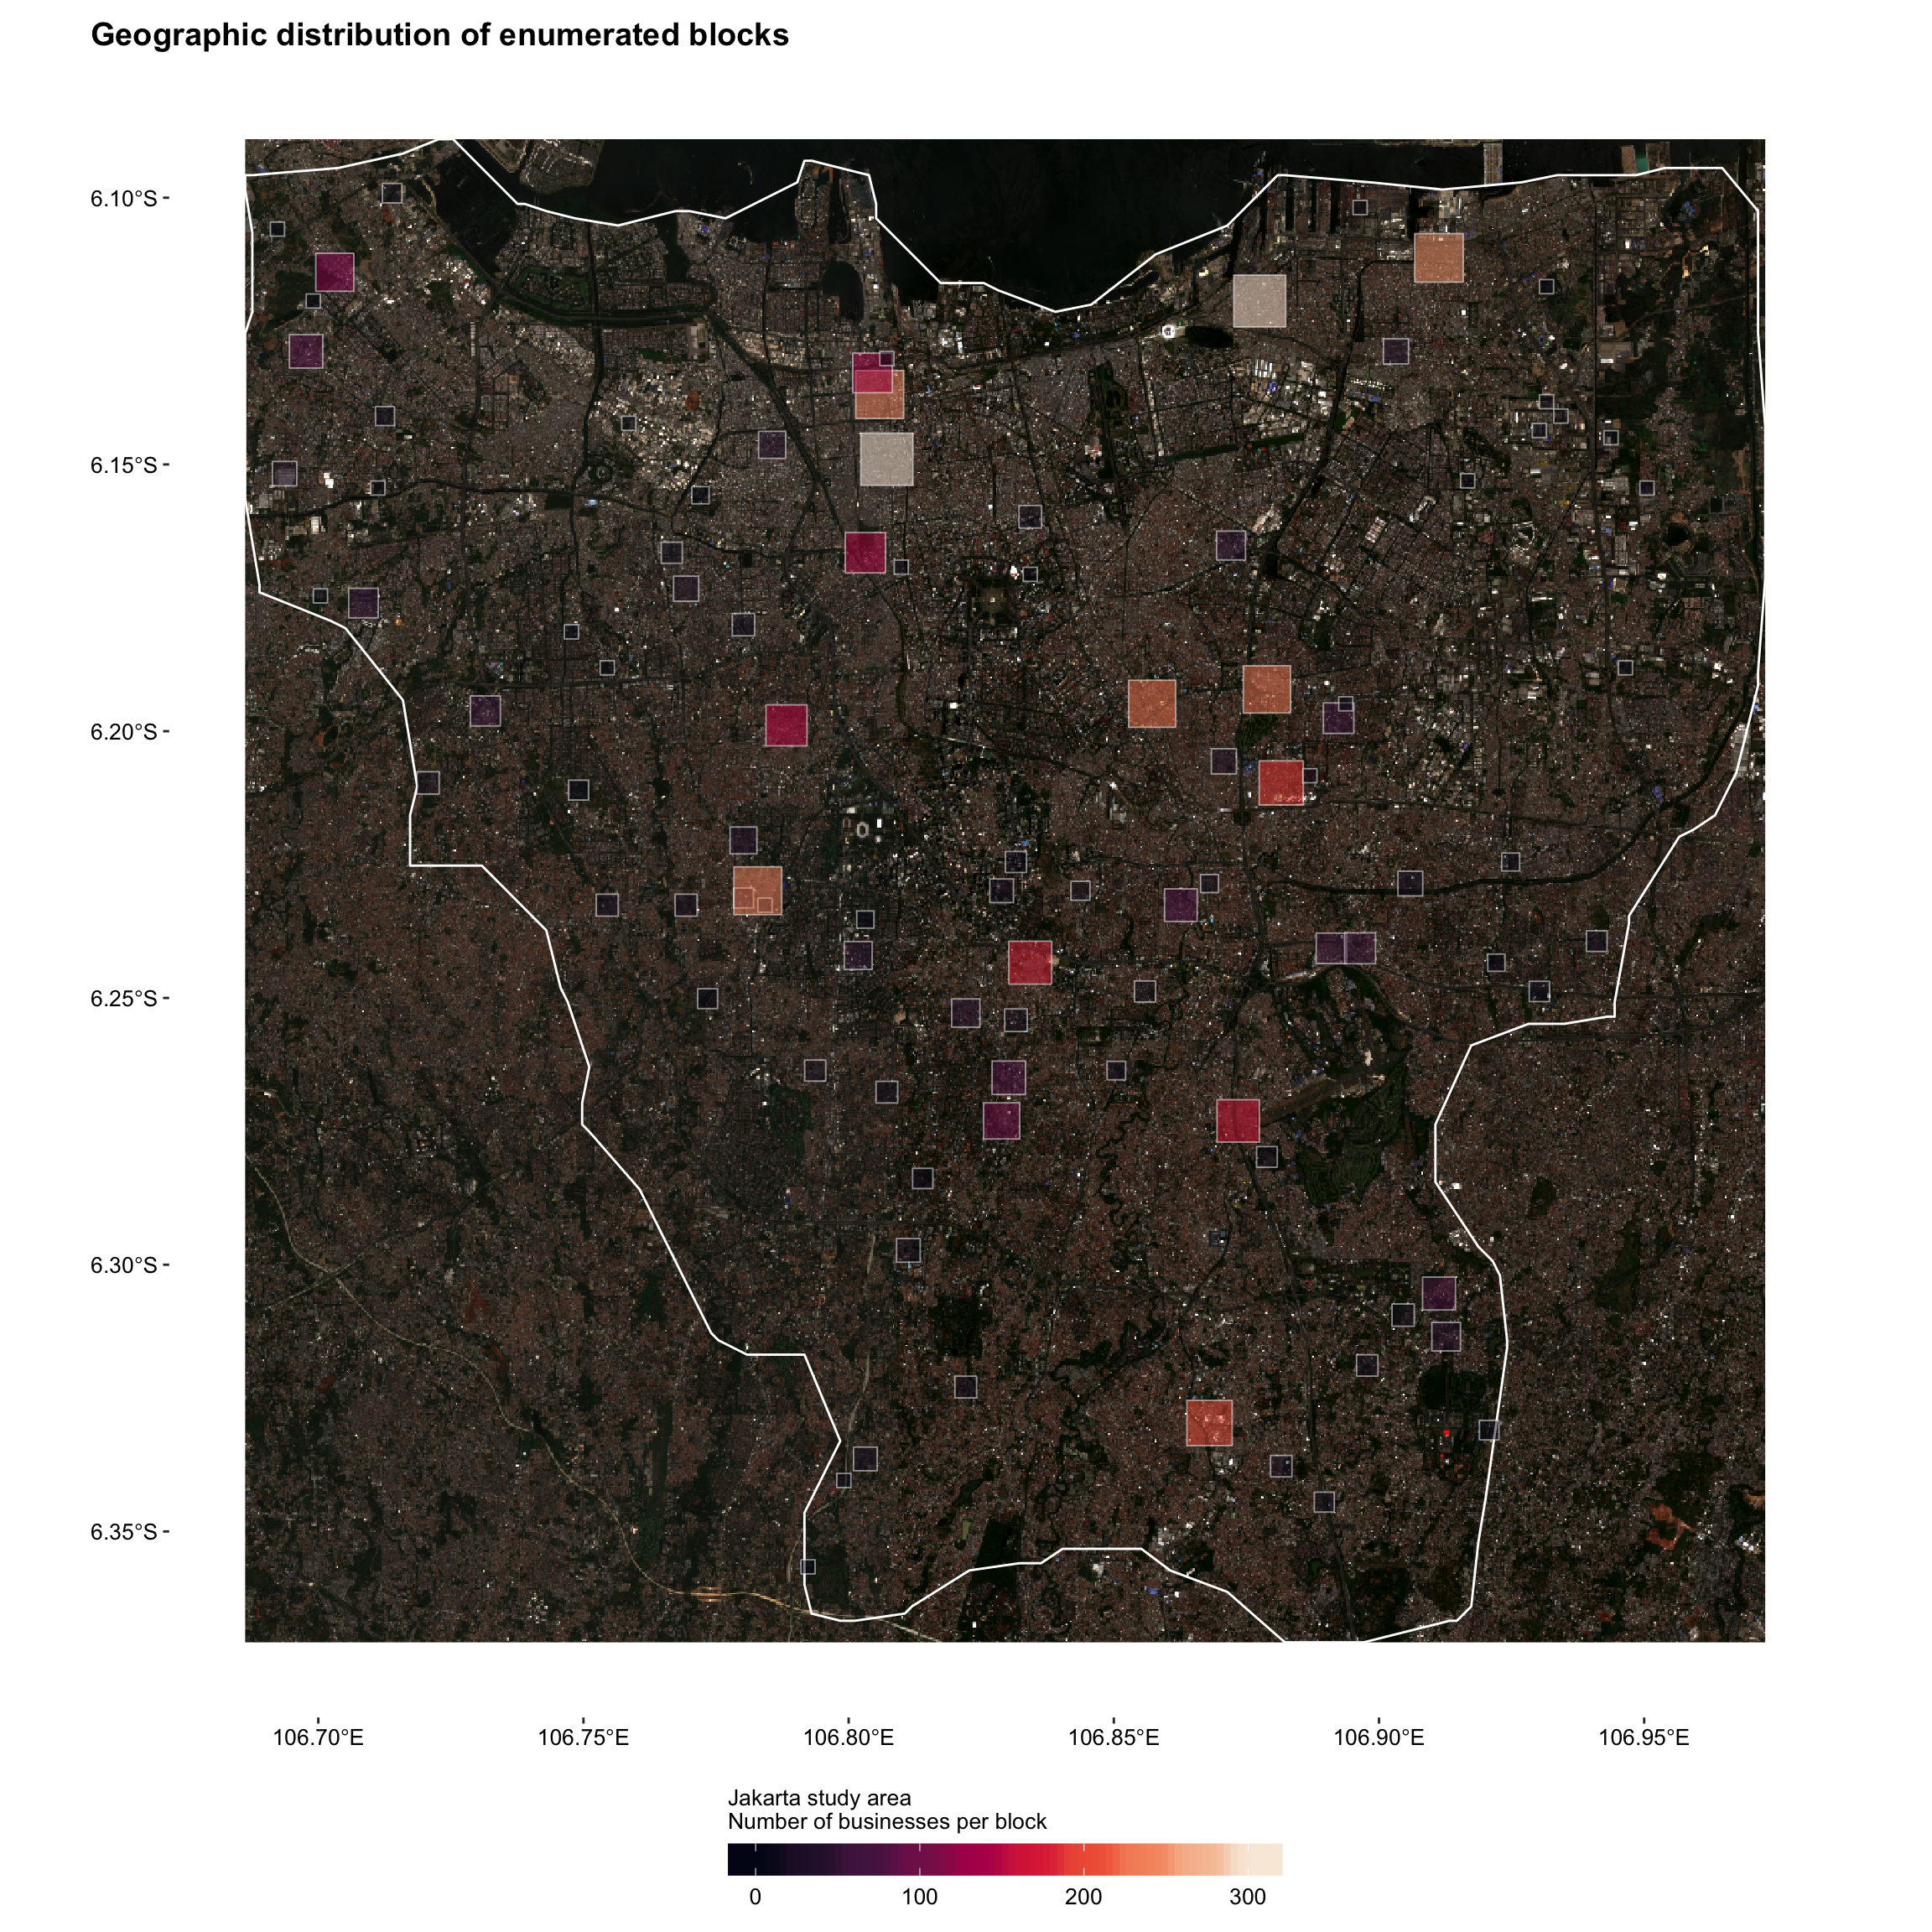
Figure 1: Geographic distribution of enumerated blocks
The business landscape
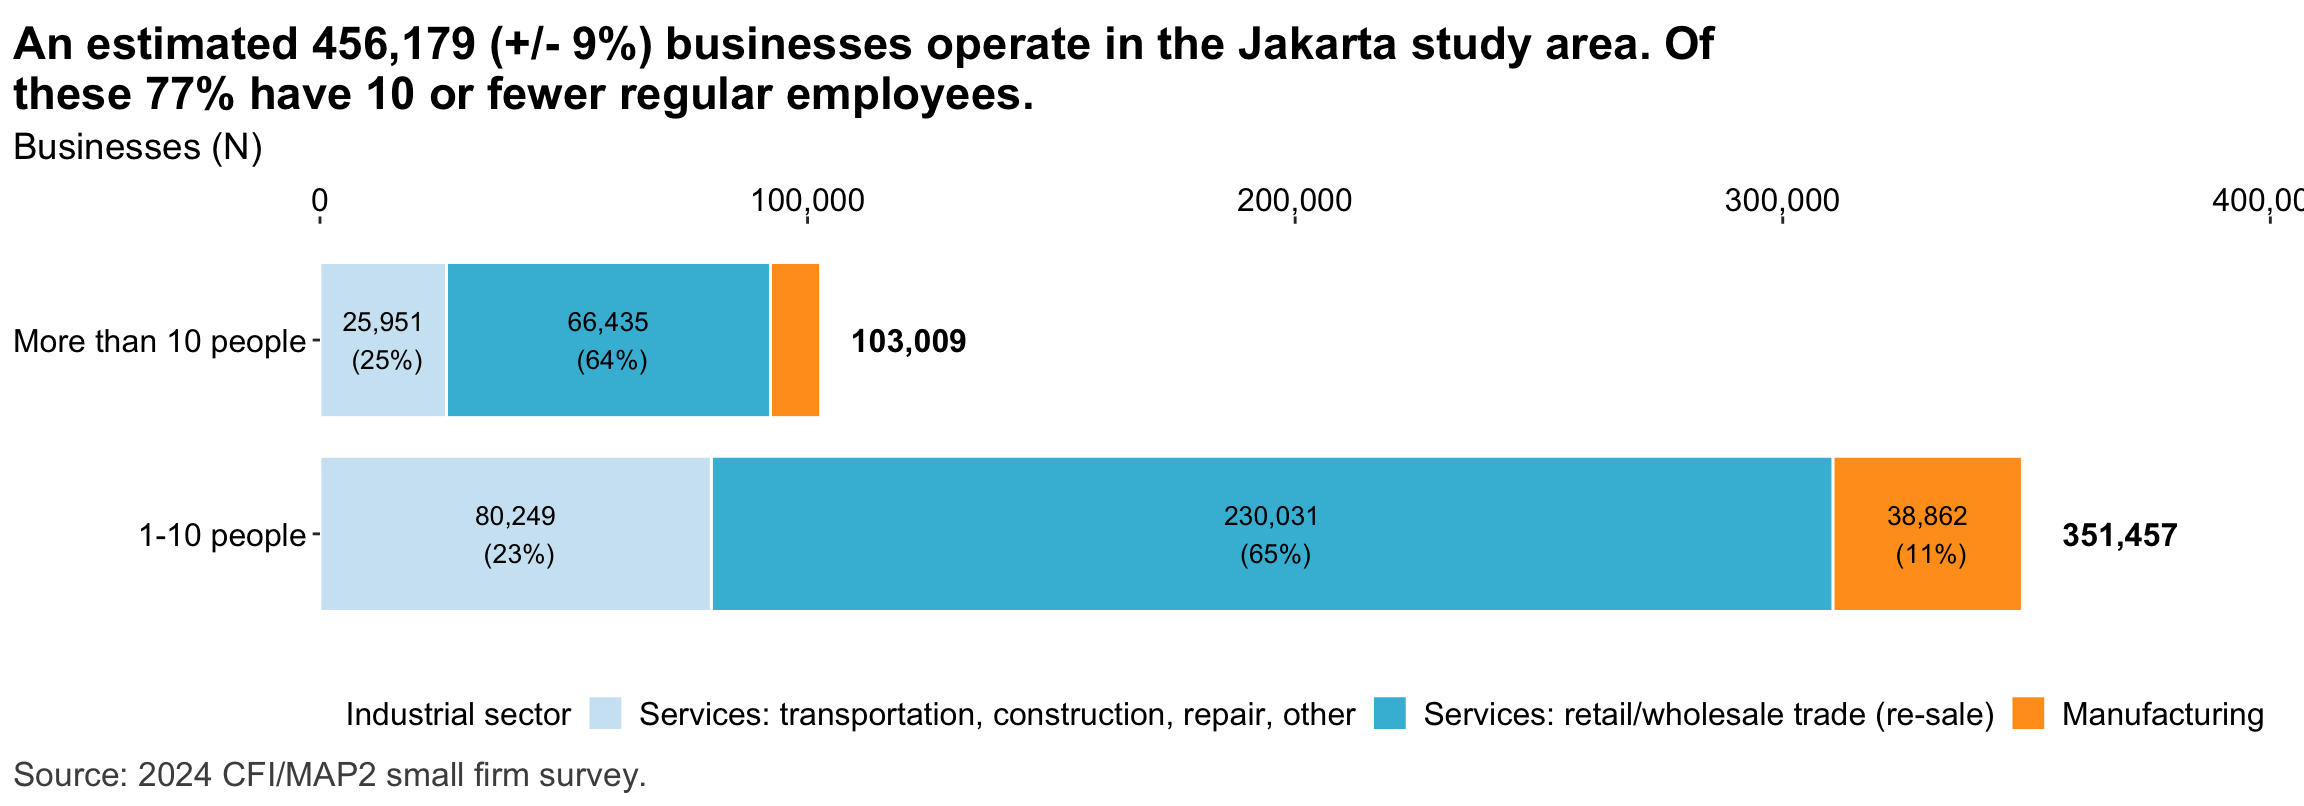
Figure 2: Estimated business population by size and sector
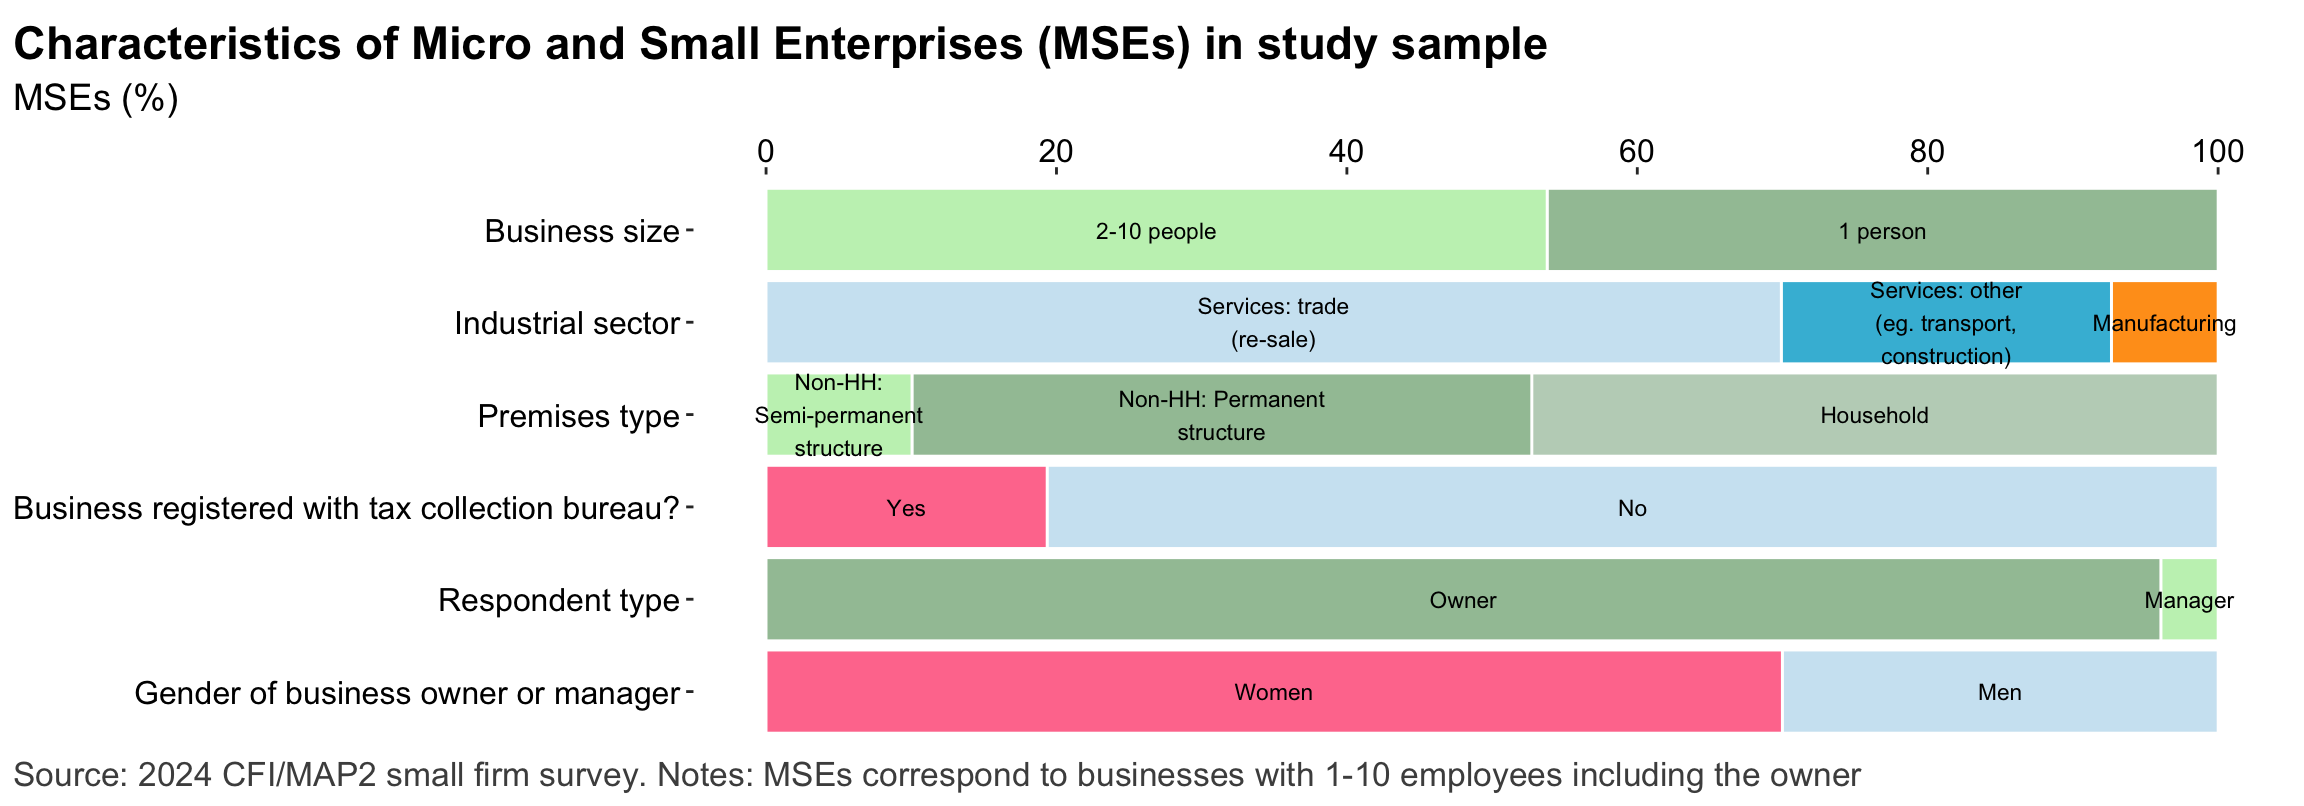
Figure 3: MSE sample characteristics
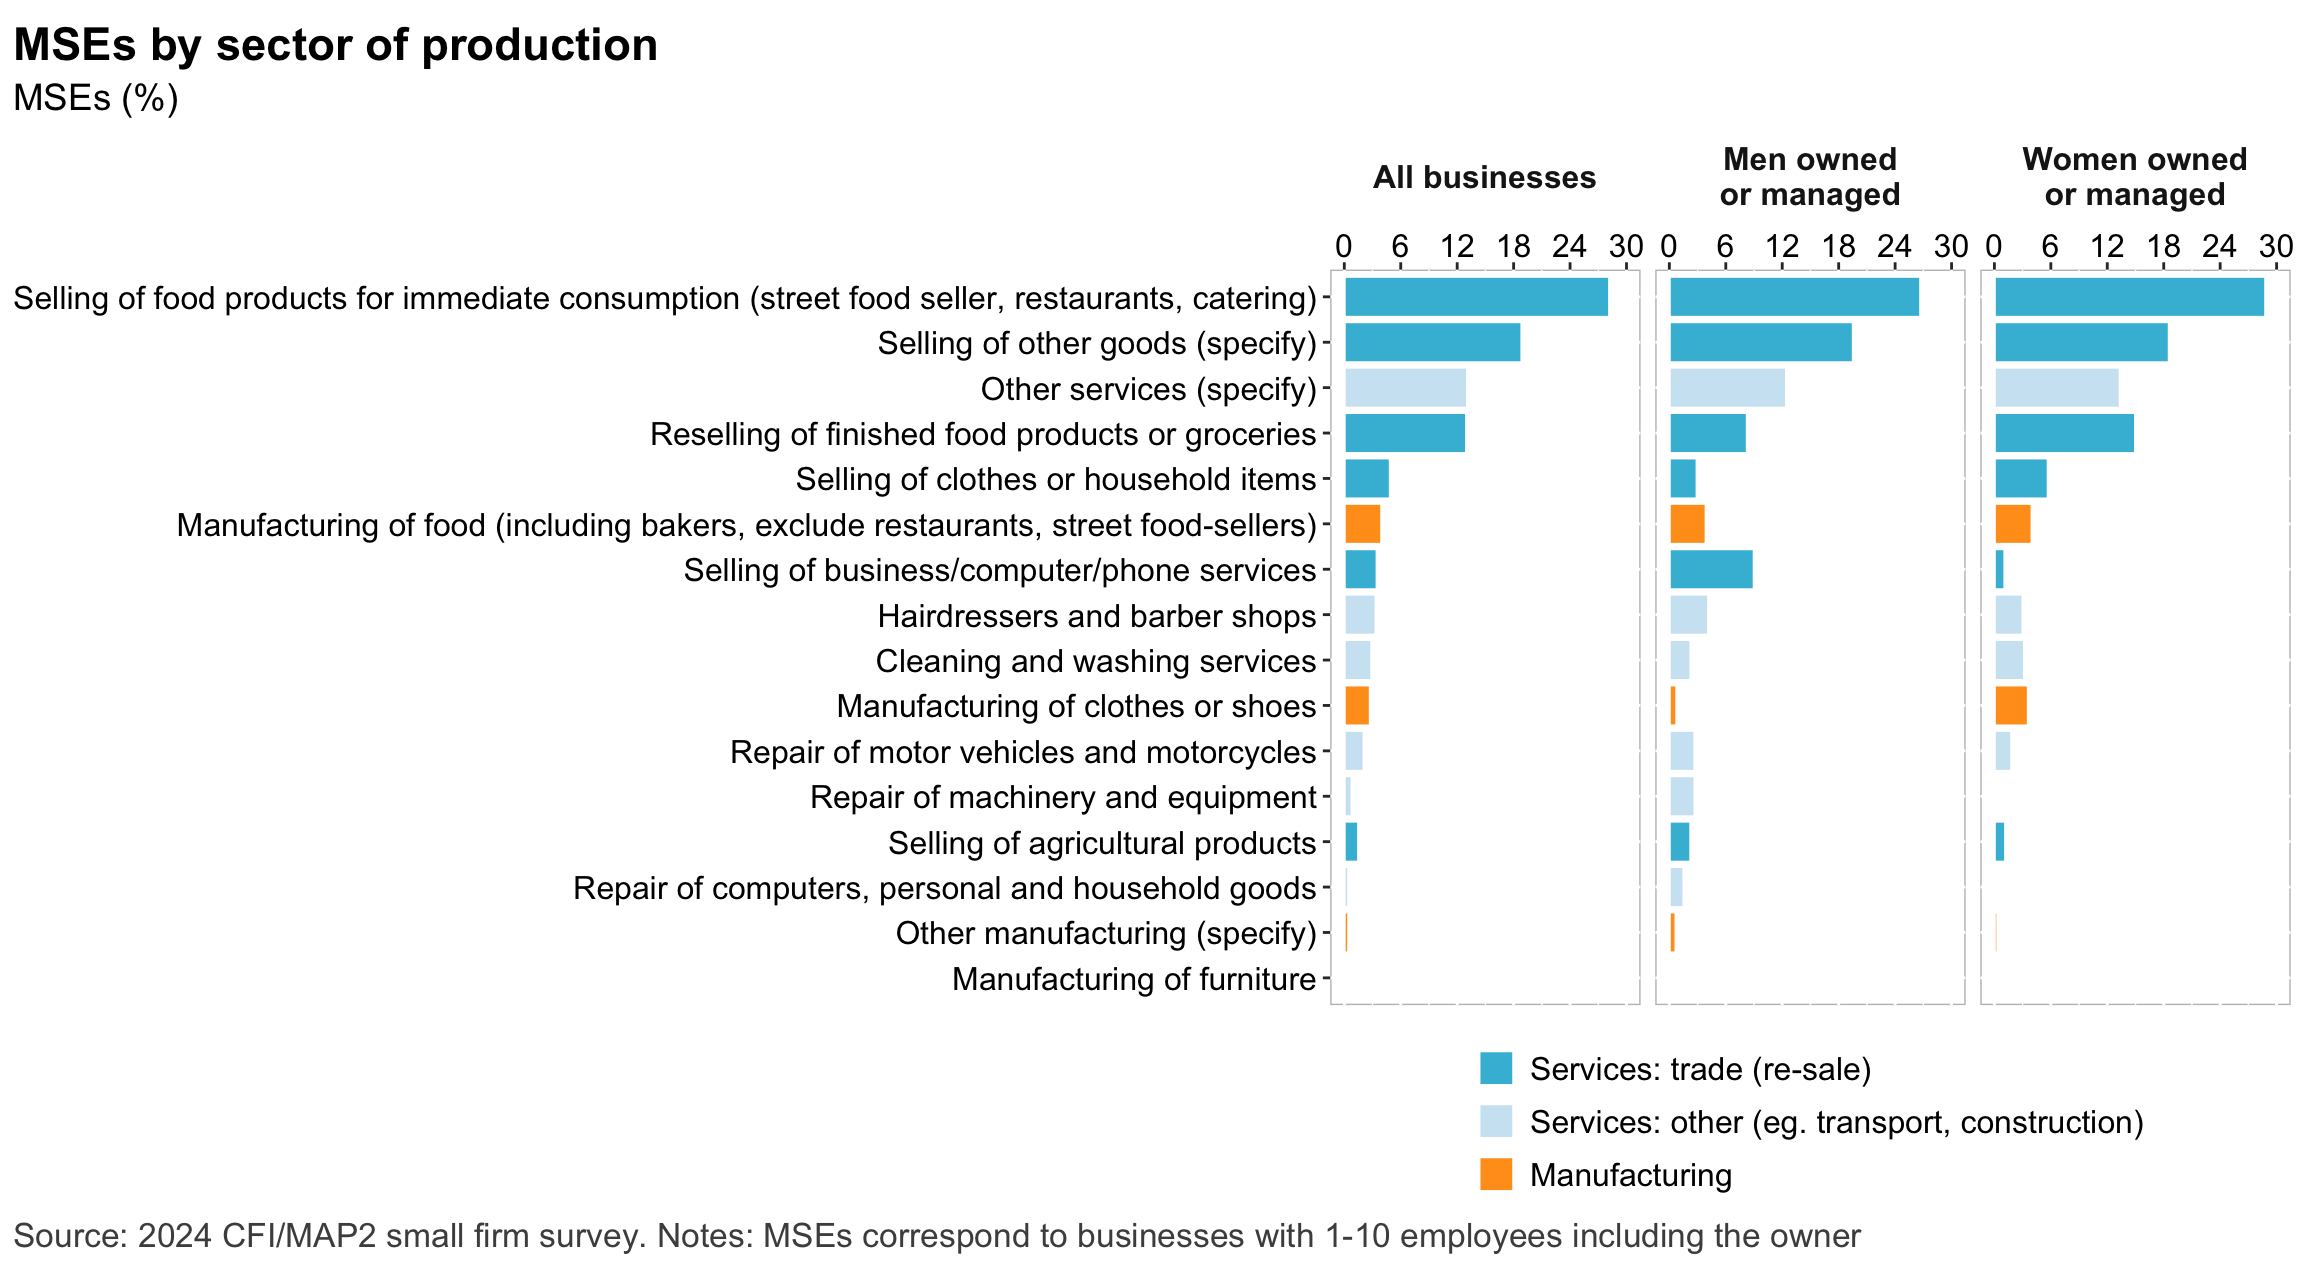
Figure 4: MSEs by sector of production
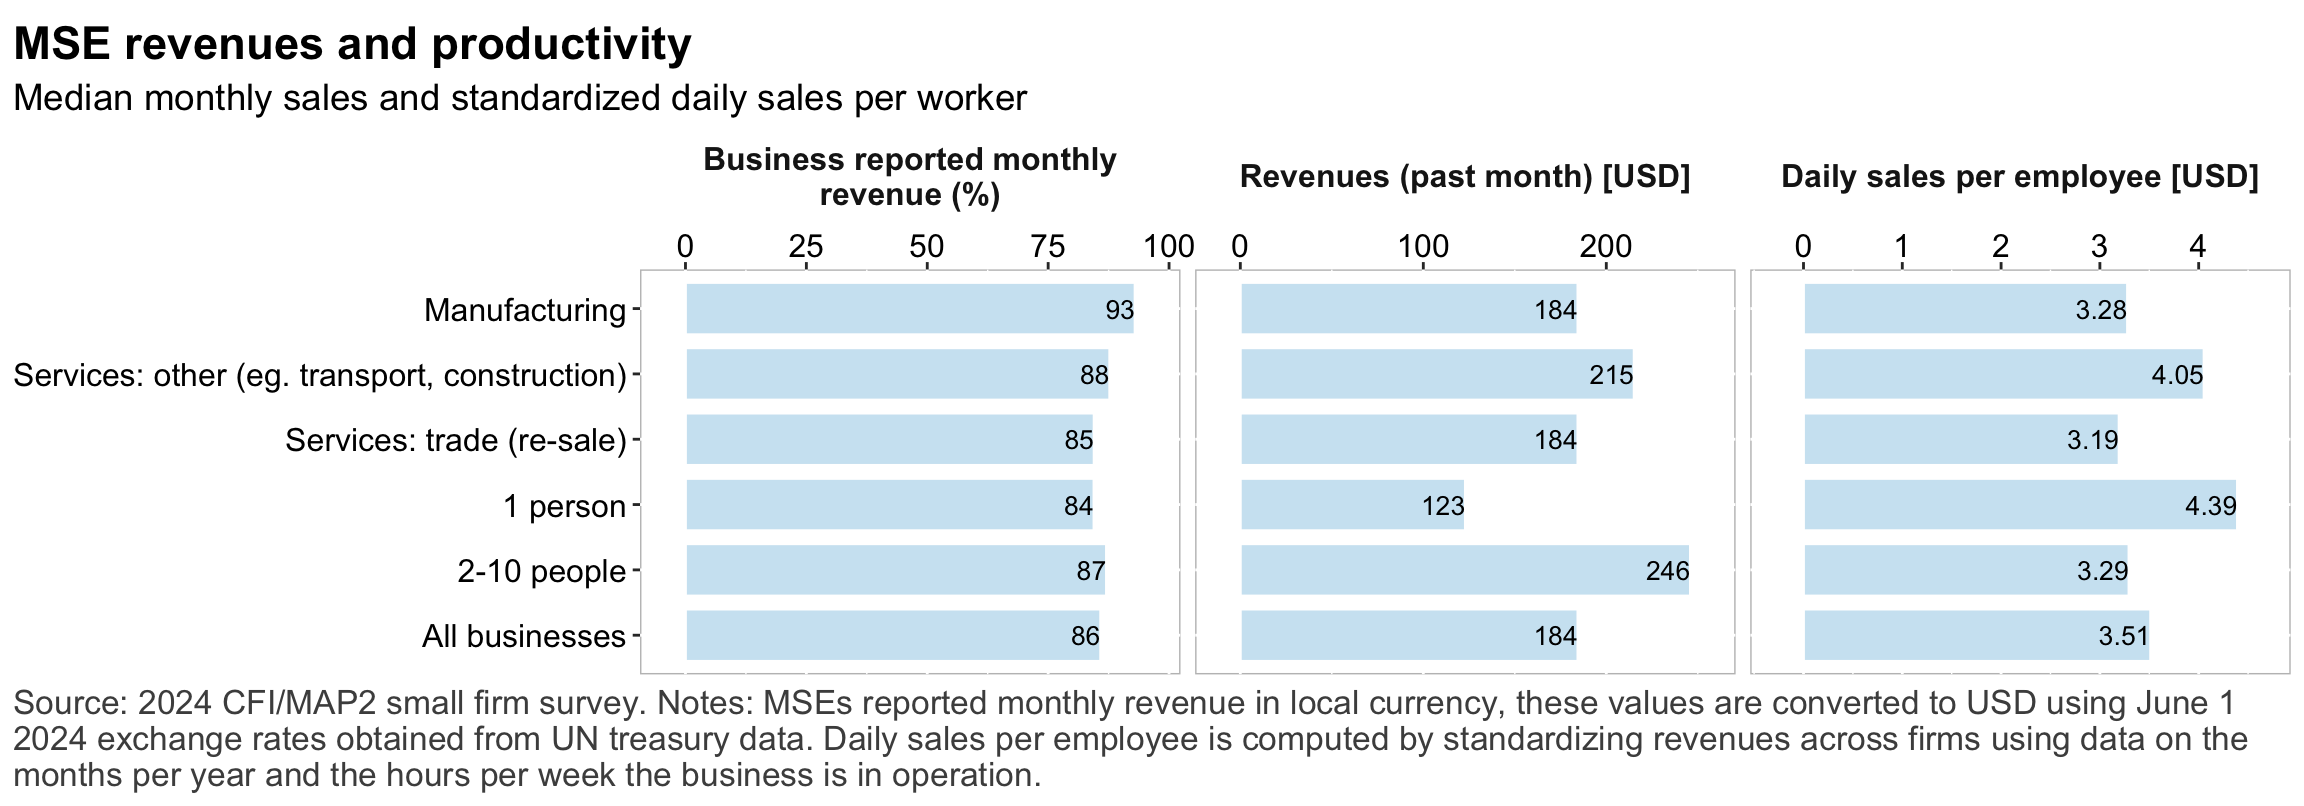
Figure 5: MSE revenues and productivity
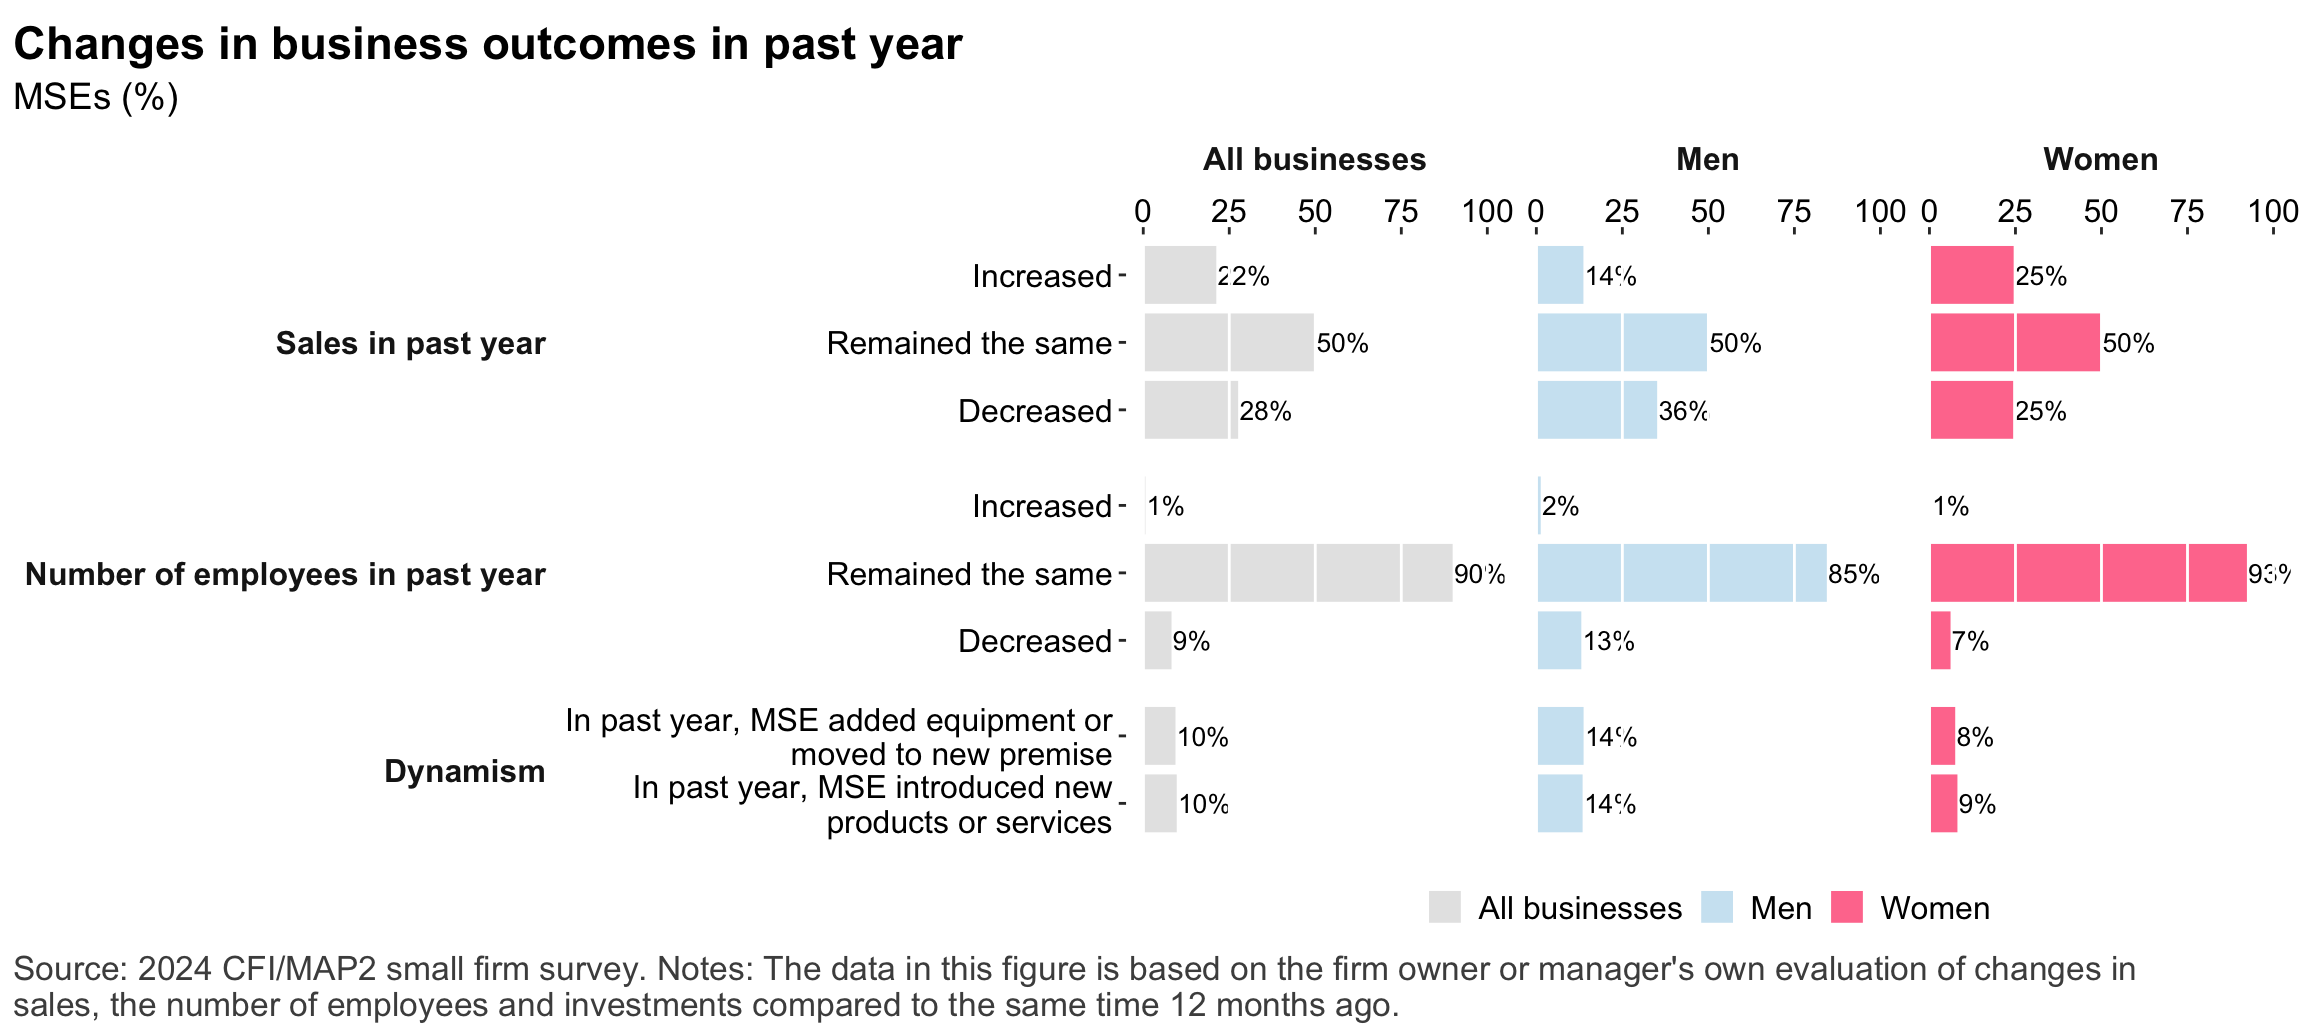
Figure 6: Changes in MSE outcomes in past year
The small firm owner
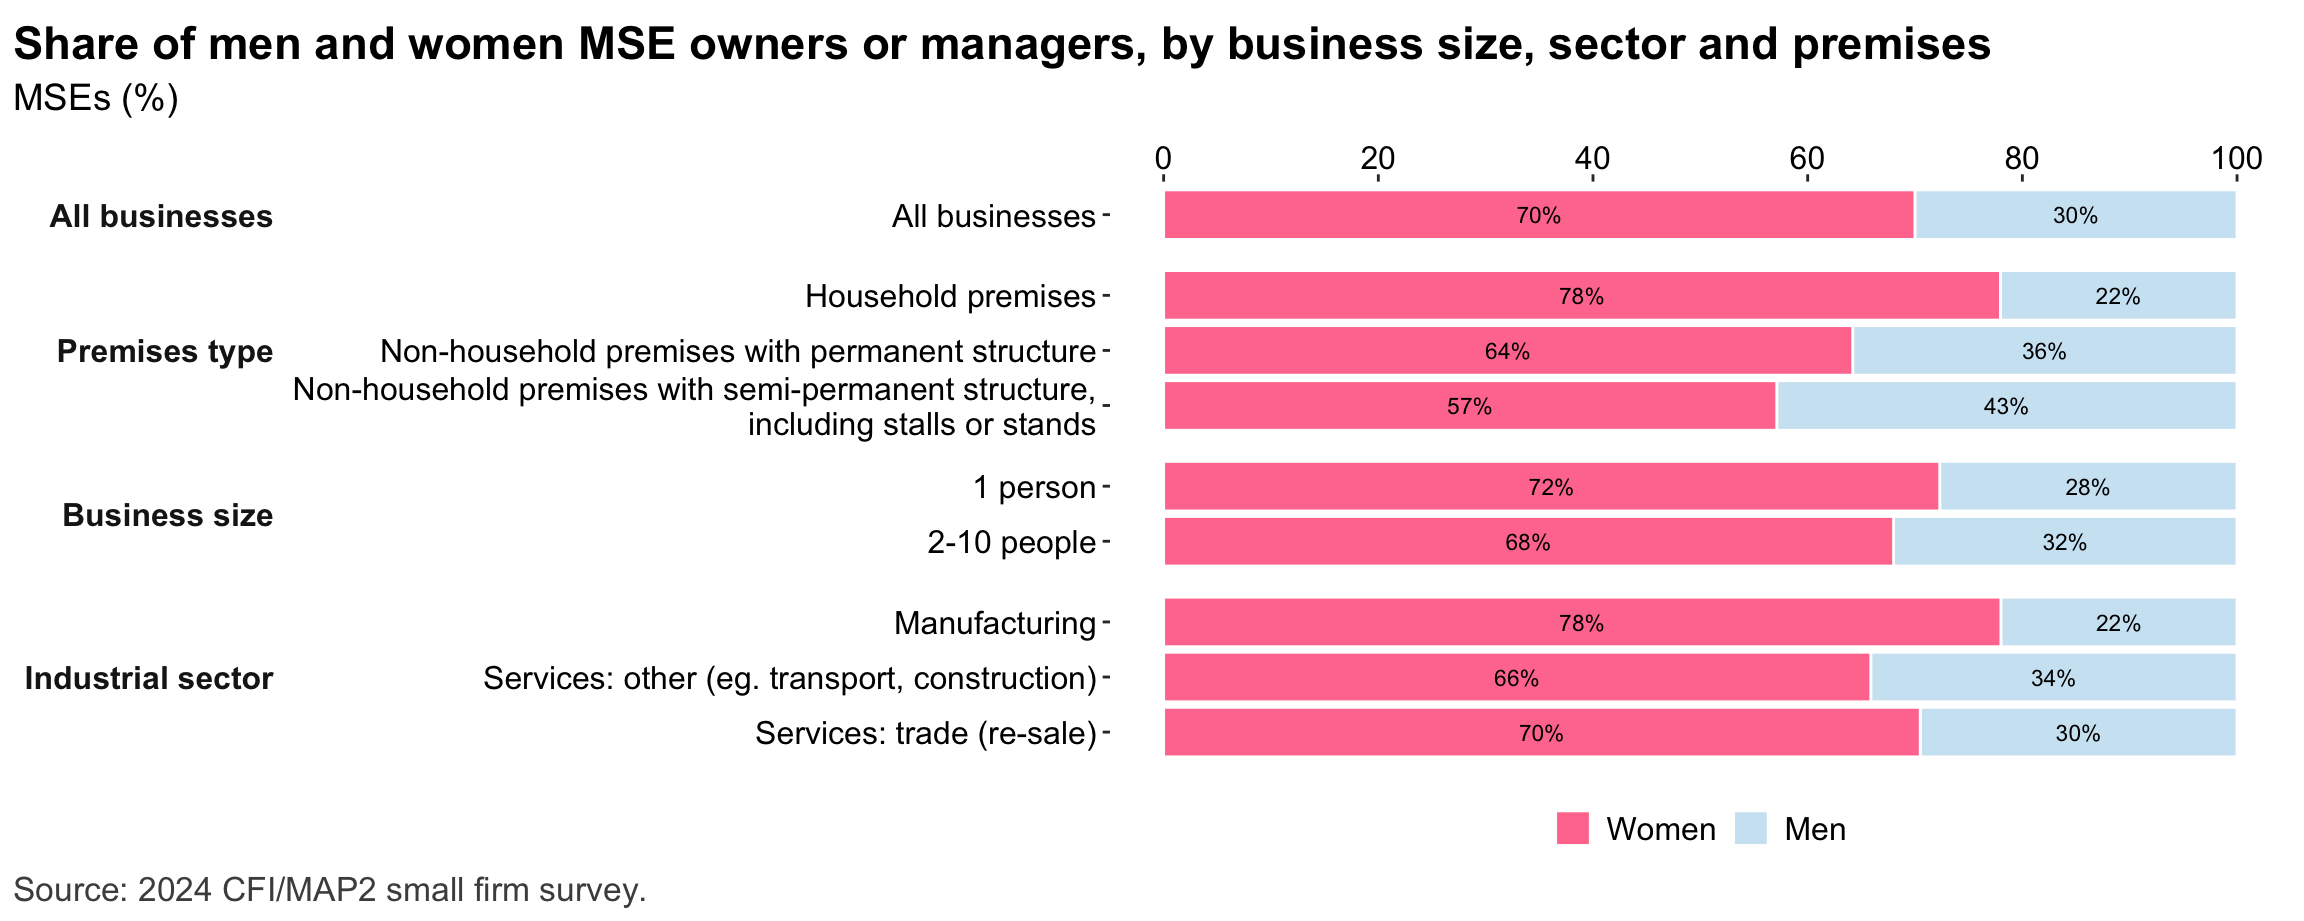
Figure 7: Gender composition of MSEs by sise and sector
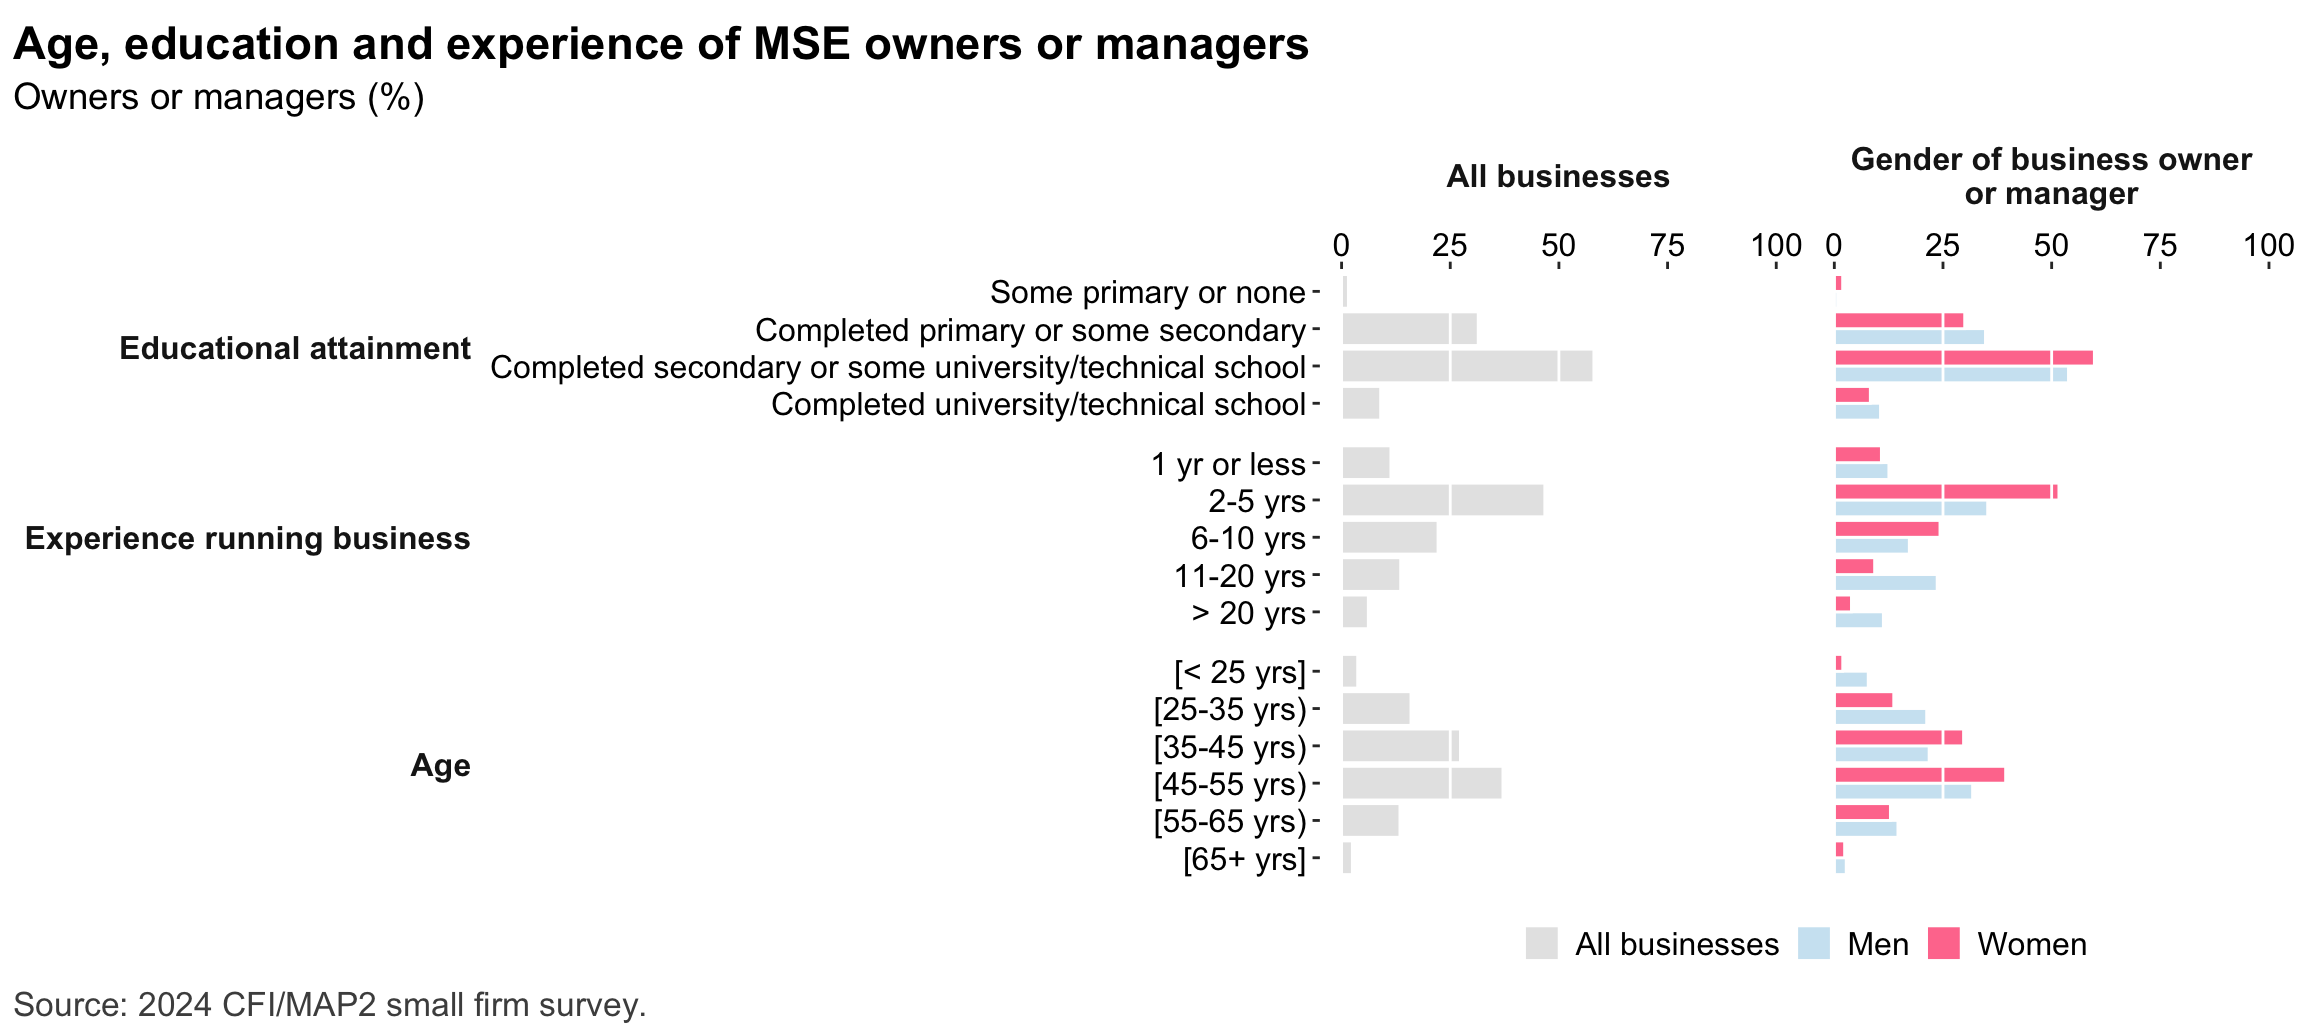
Figure 8: MSE owner characteristics
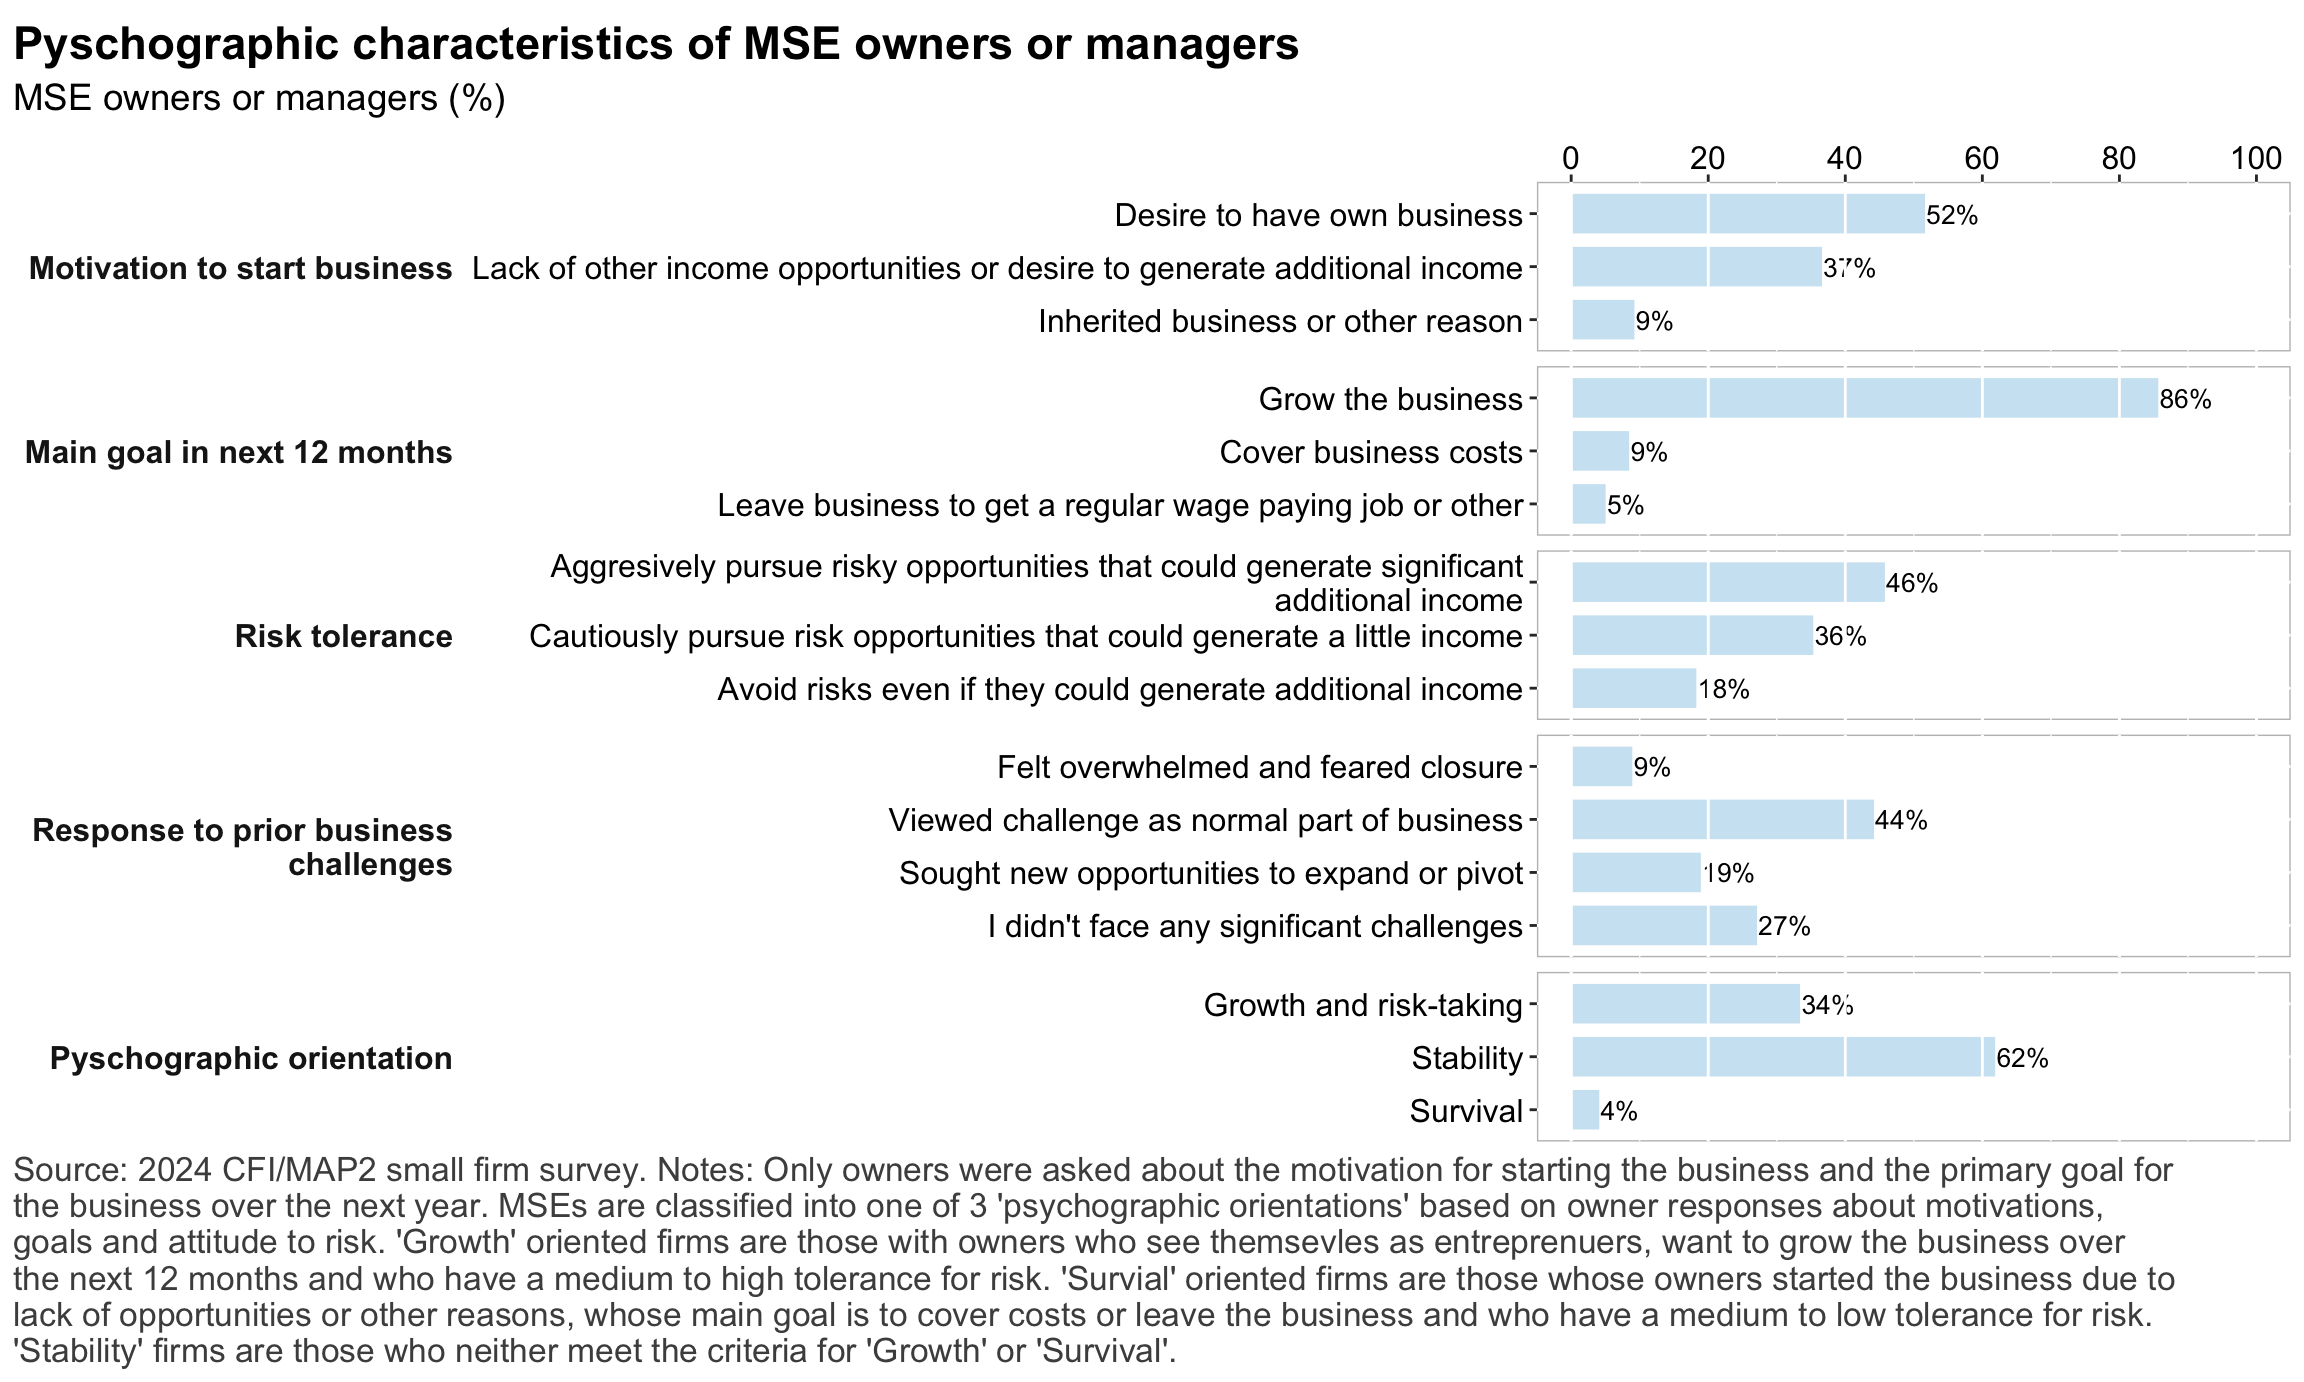
Figure 9: Pyschographic characrteristics of SME owners or managers, by gender
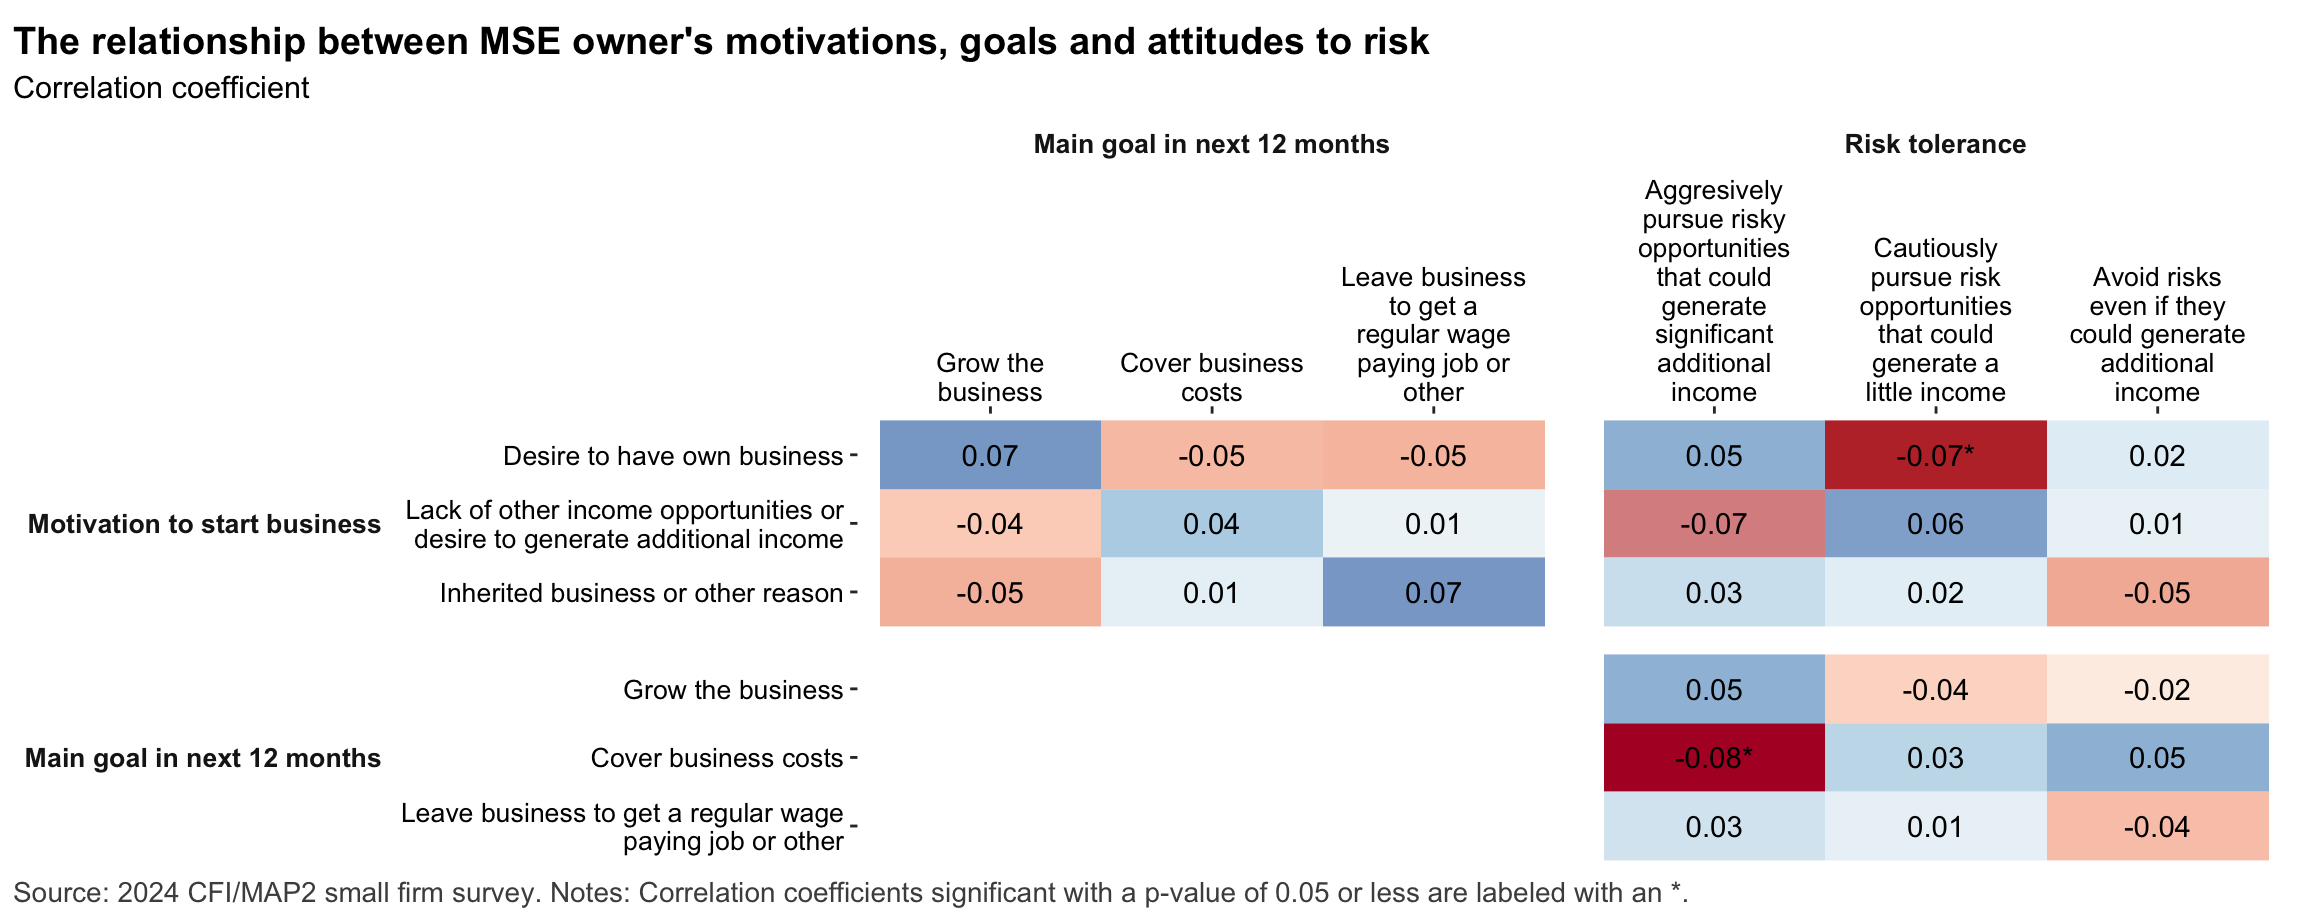
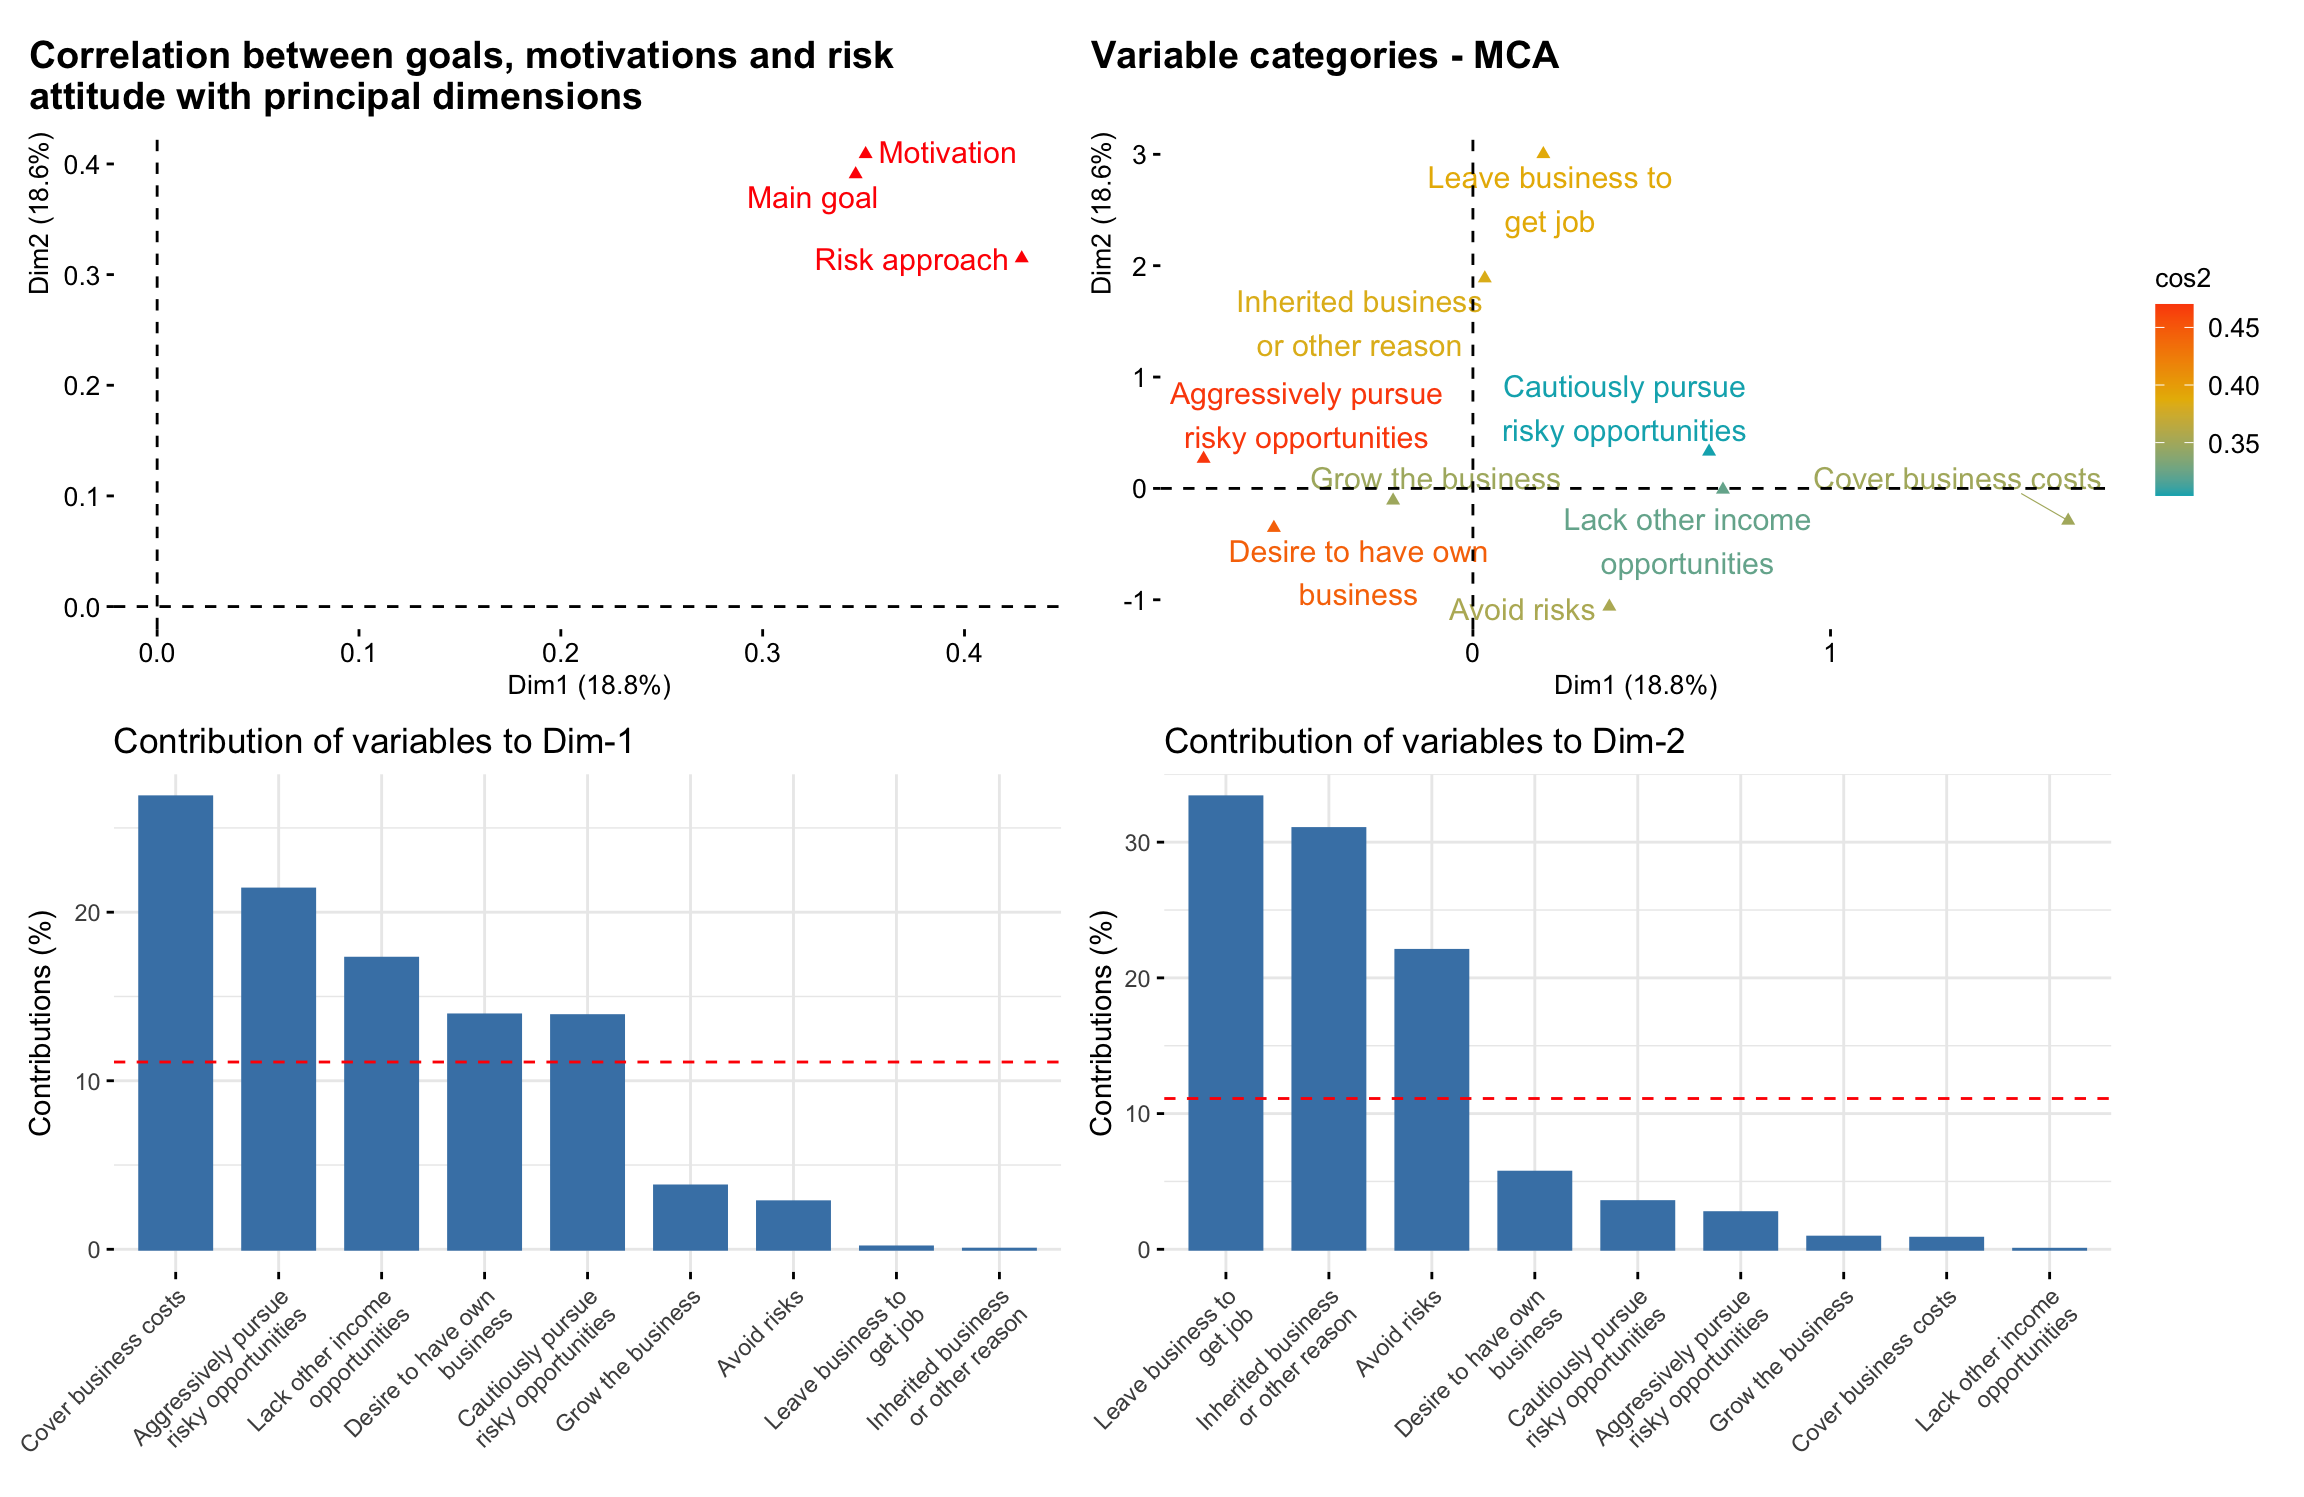
Figure 10: Correlation between owner’s motivations, goals and attitudes to risk
Figure 11: Correlation between owner’s motivations, goals and attitudes to risk
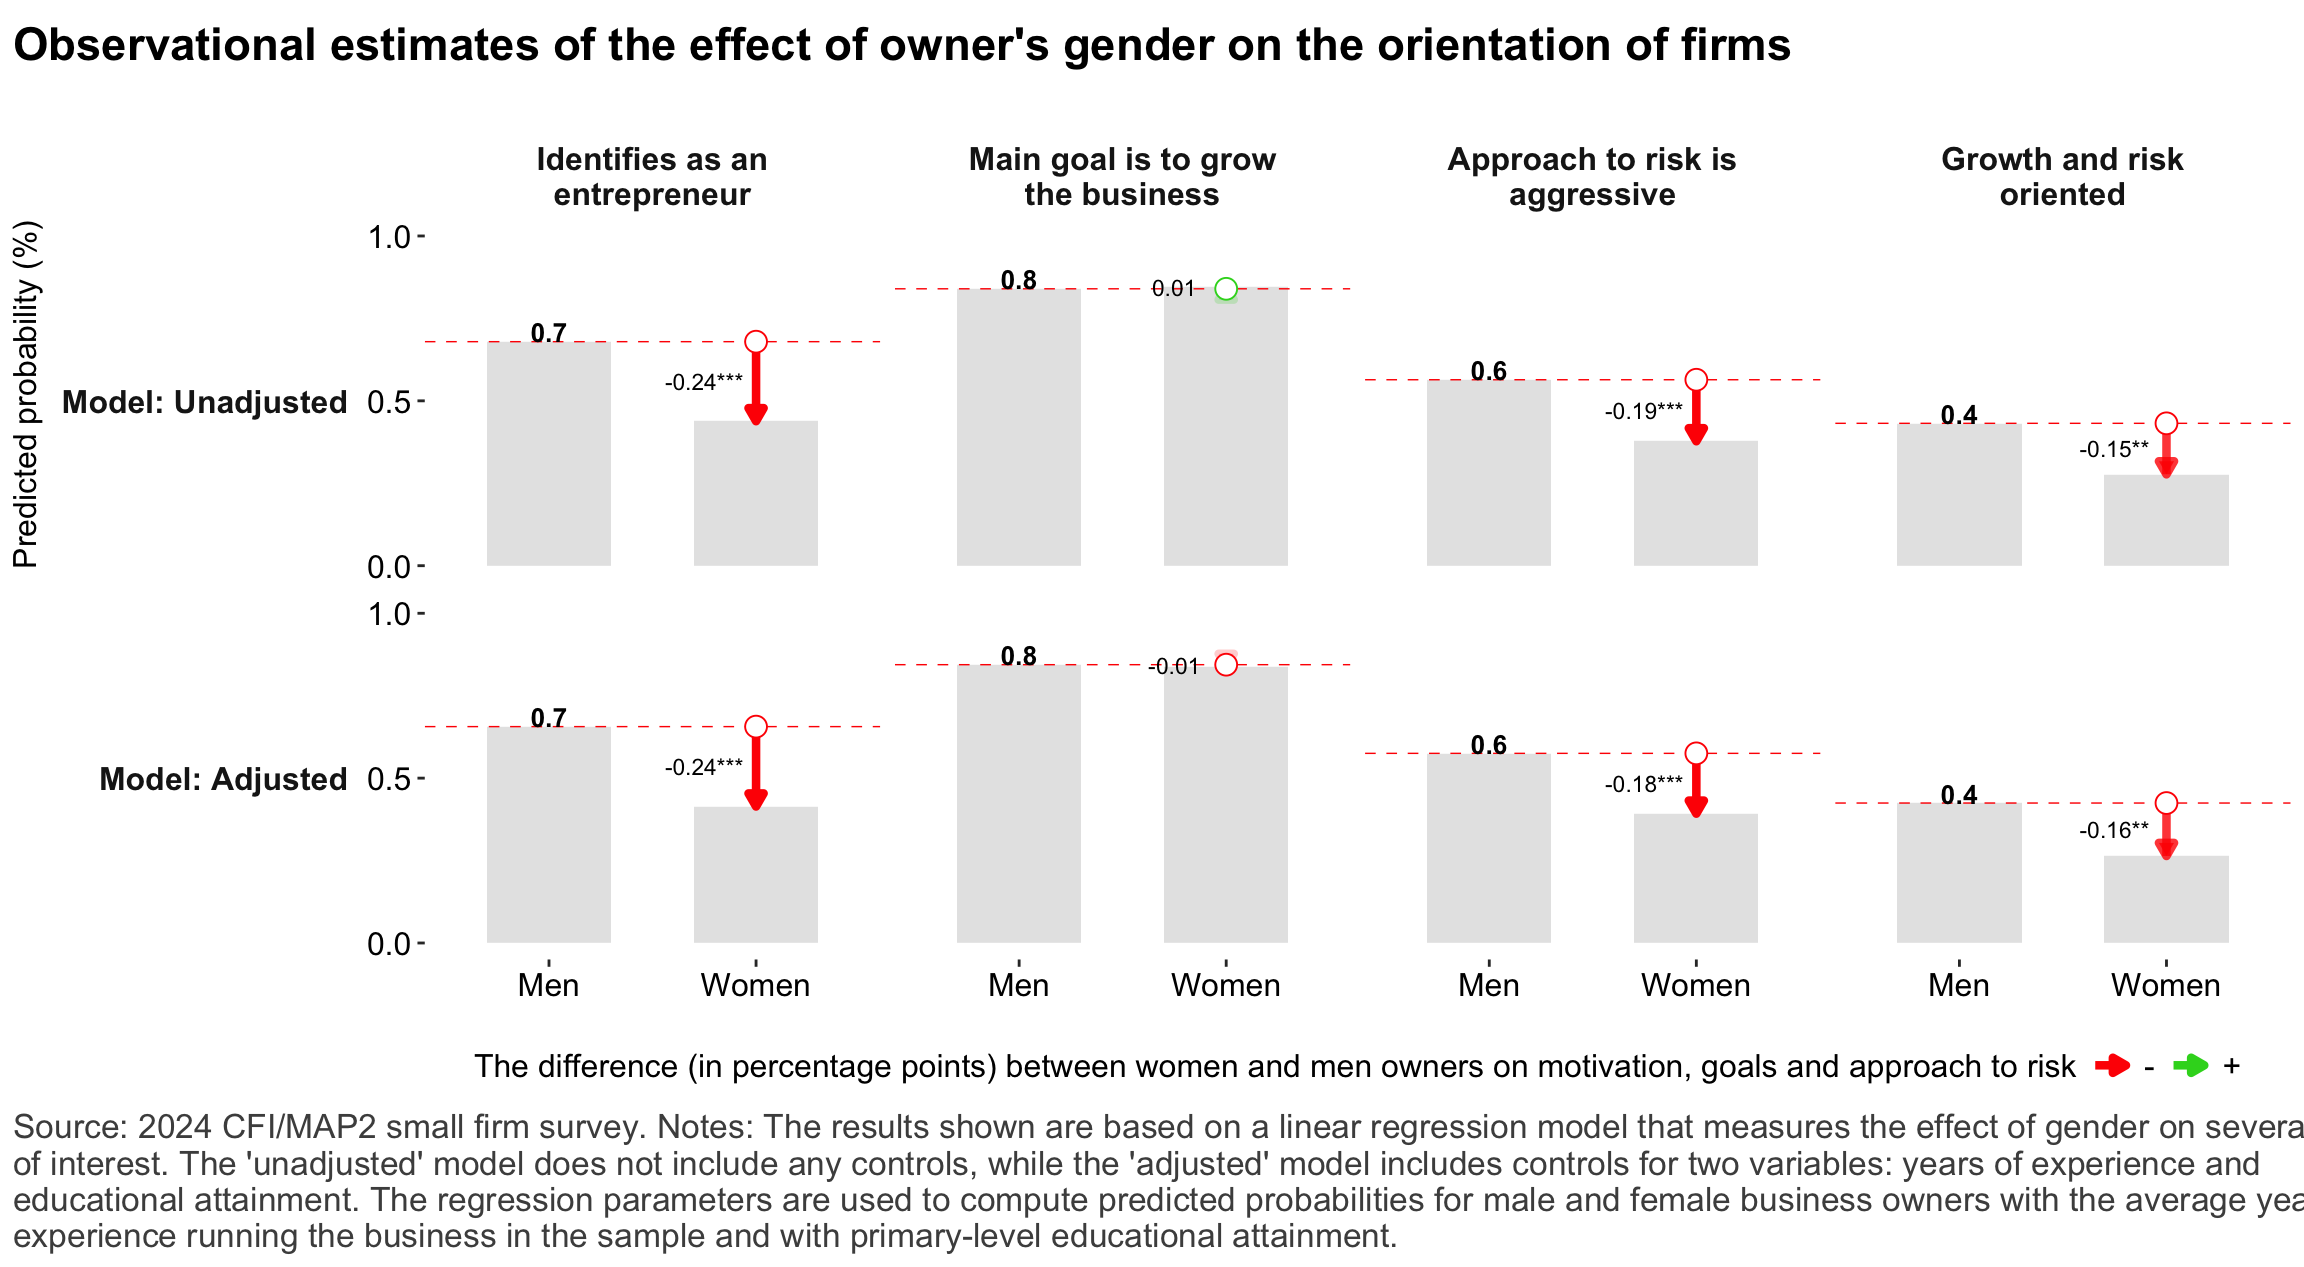
Figure 12: Relationship between owner’s gender and motivations, goals and attitudes to risk
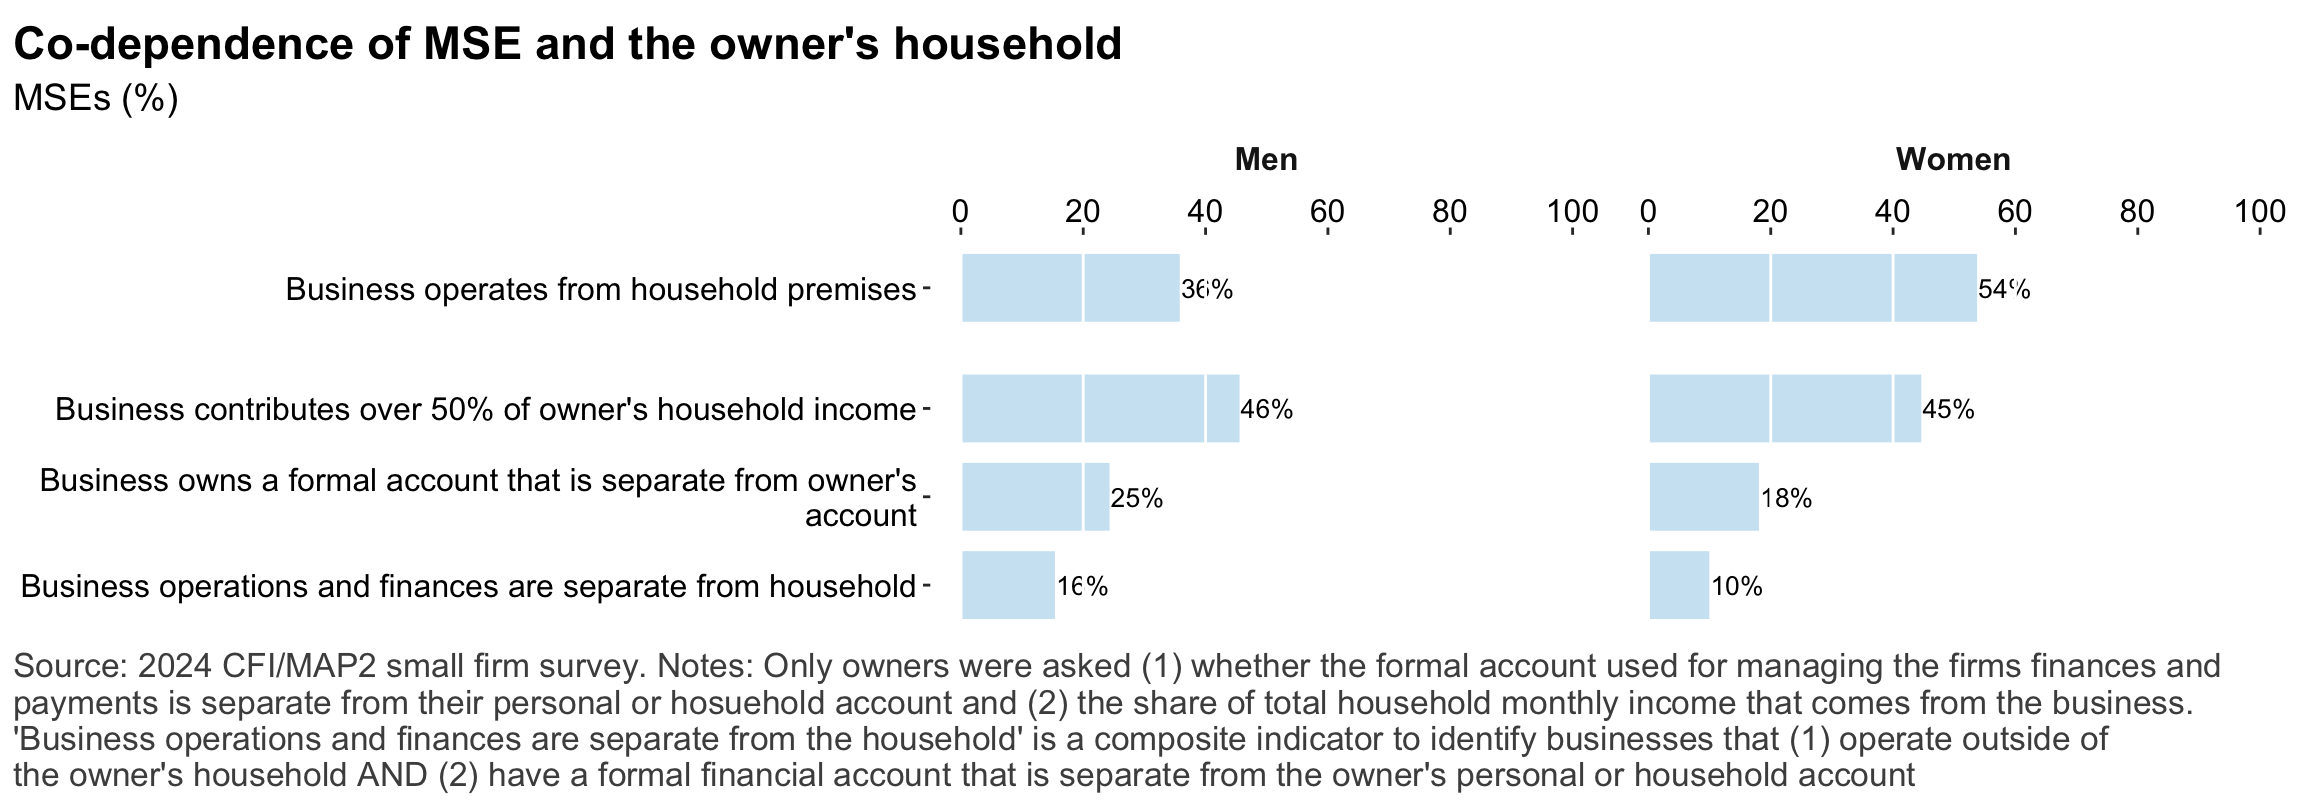
Figure 13: MSEs and codependence with owner’s household
Digital technology
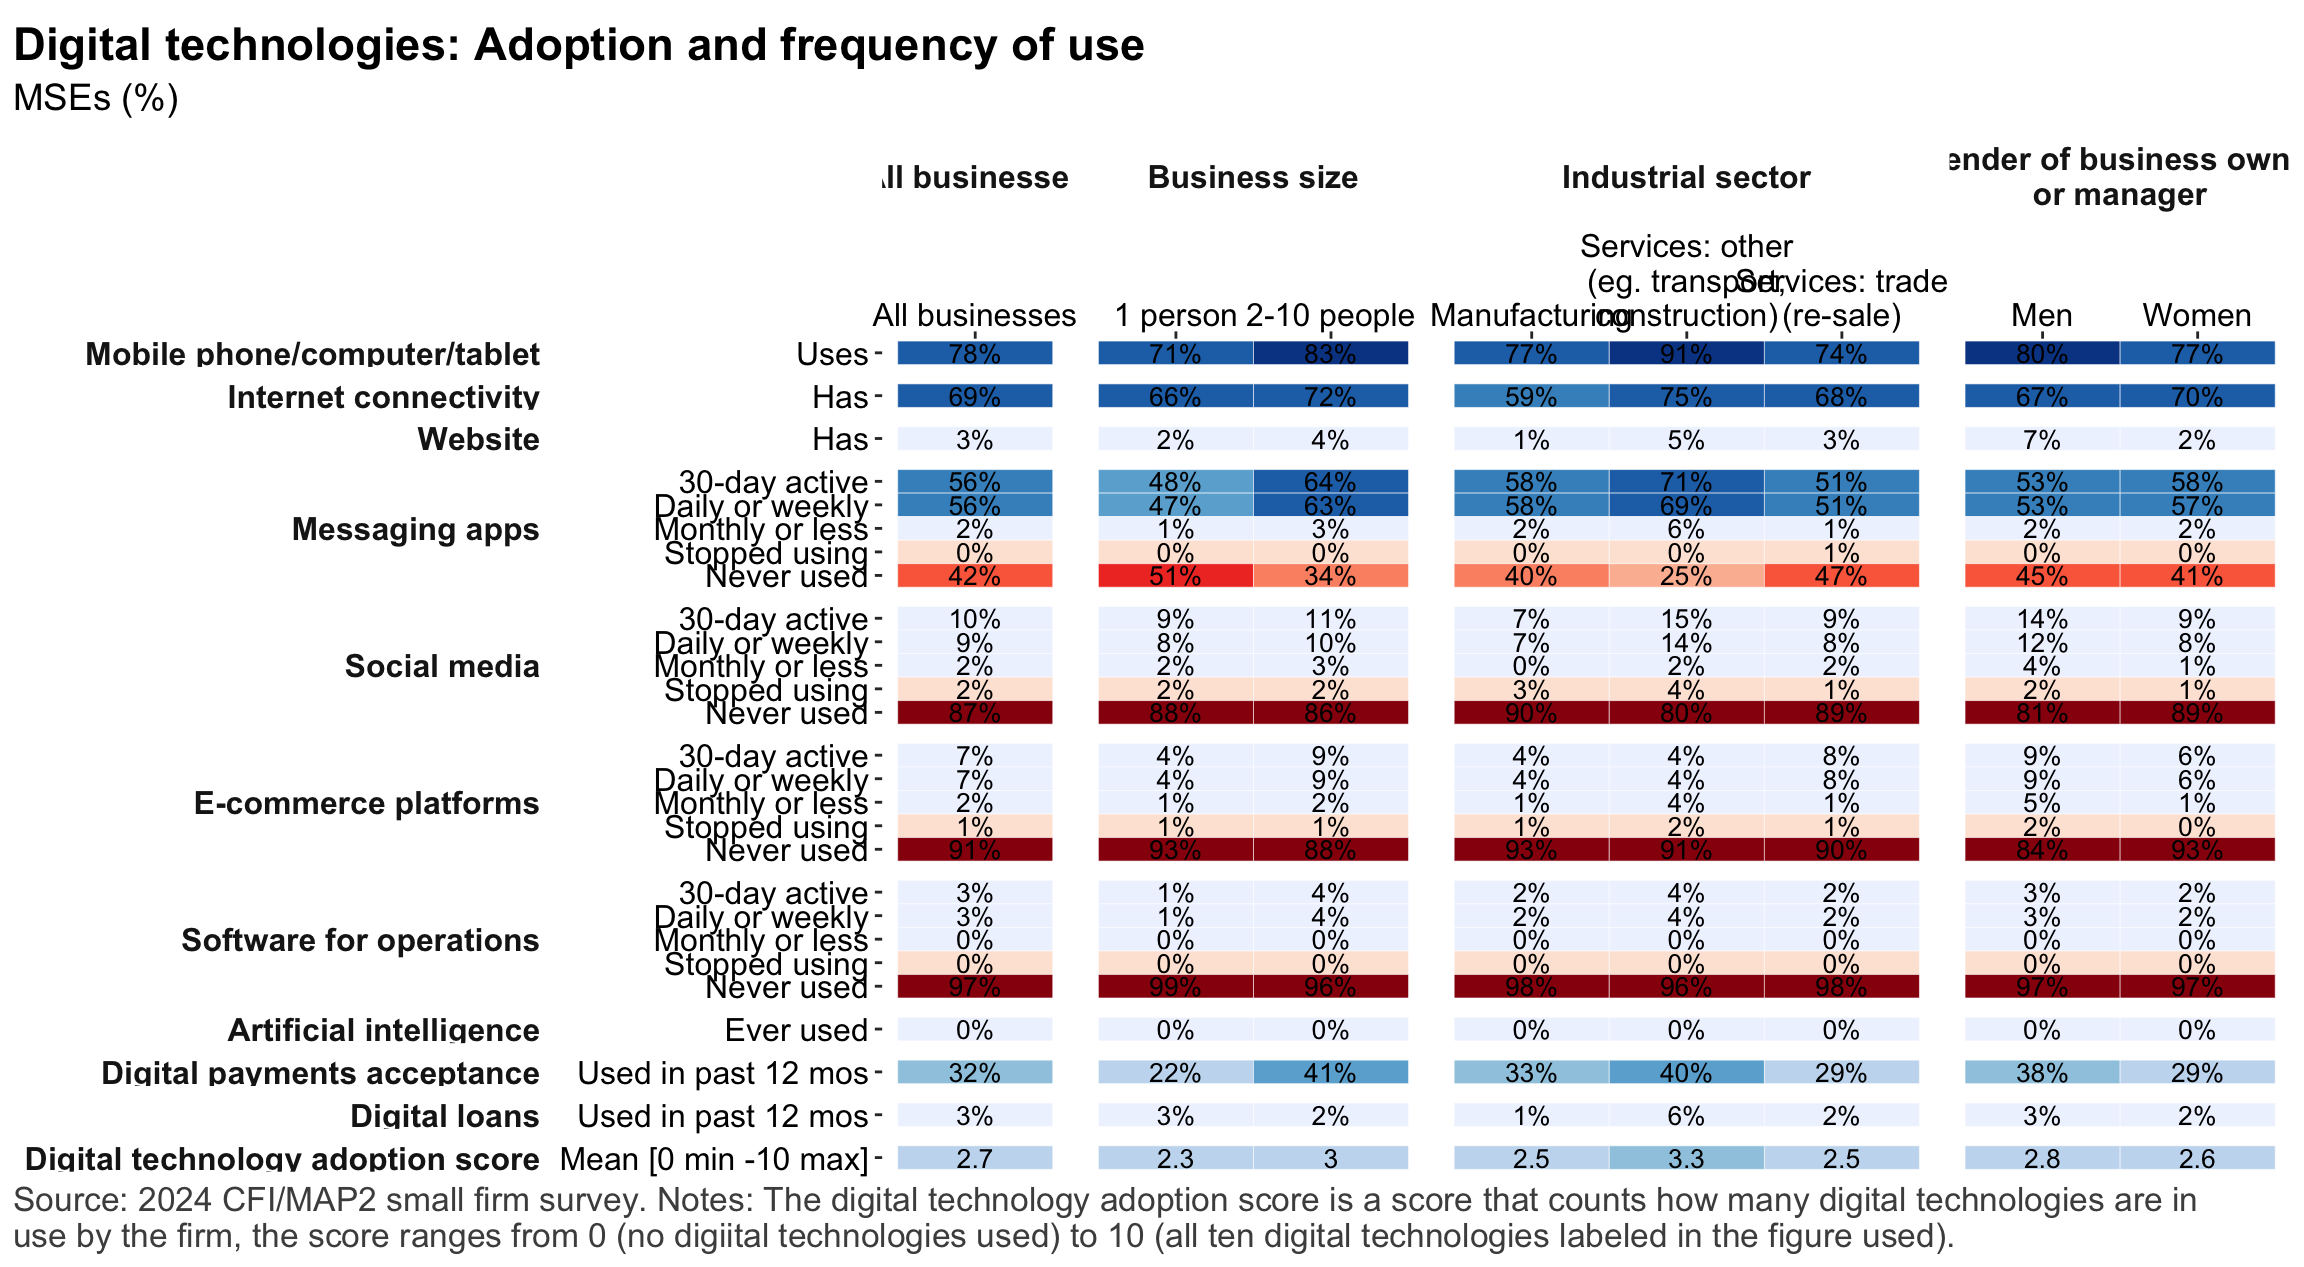
Figure 14: Access to connectivity and devices
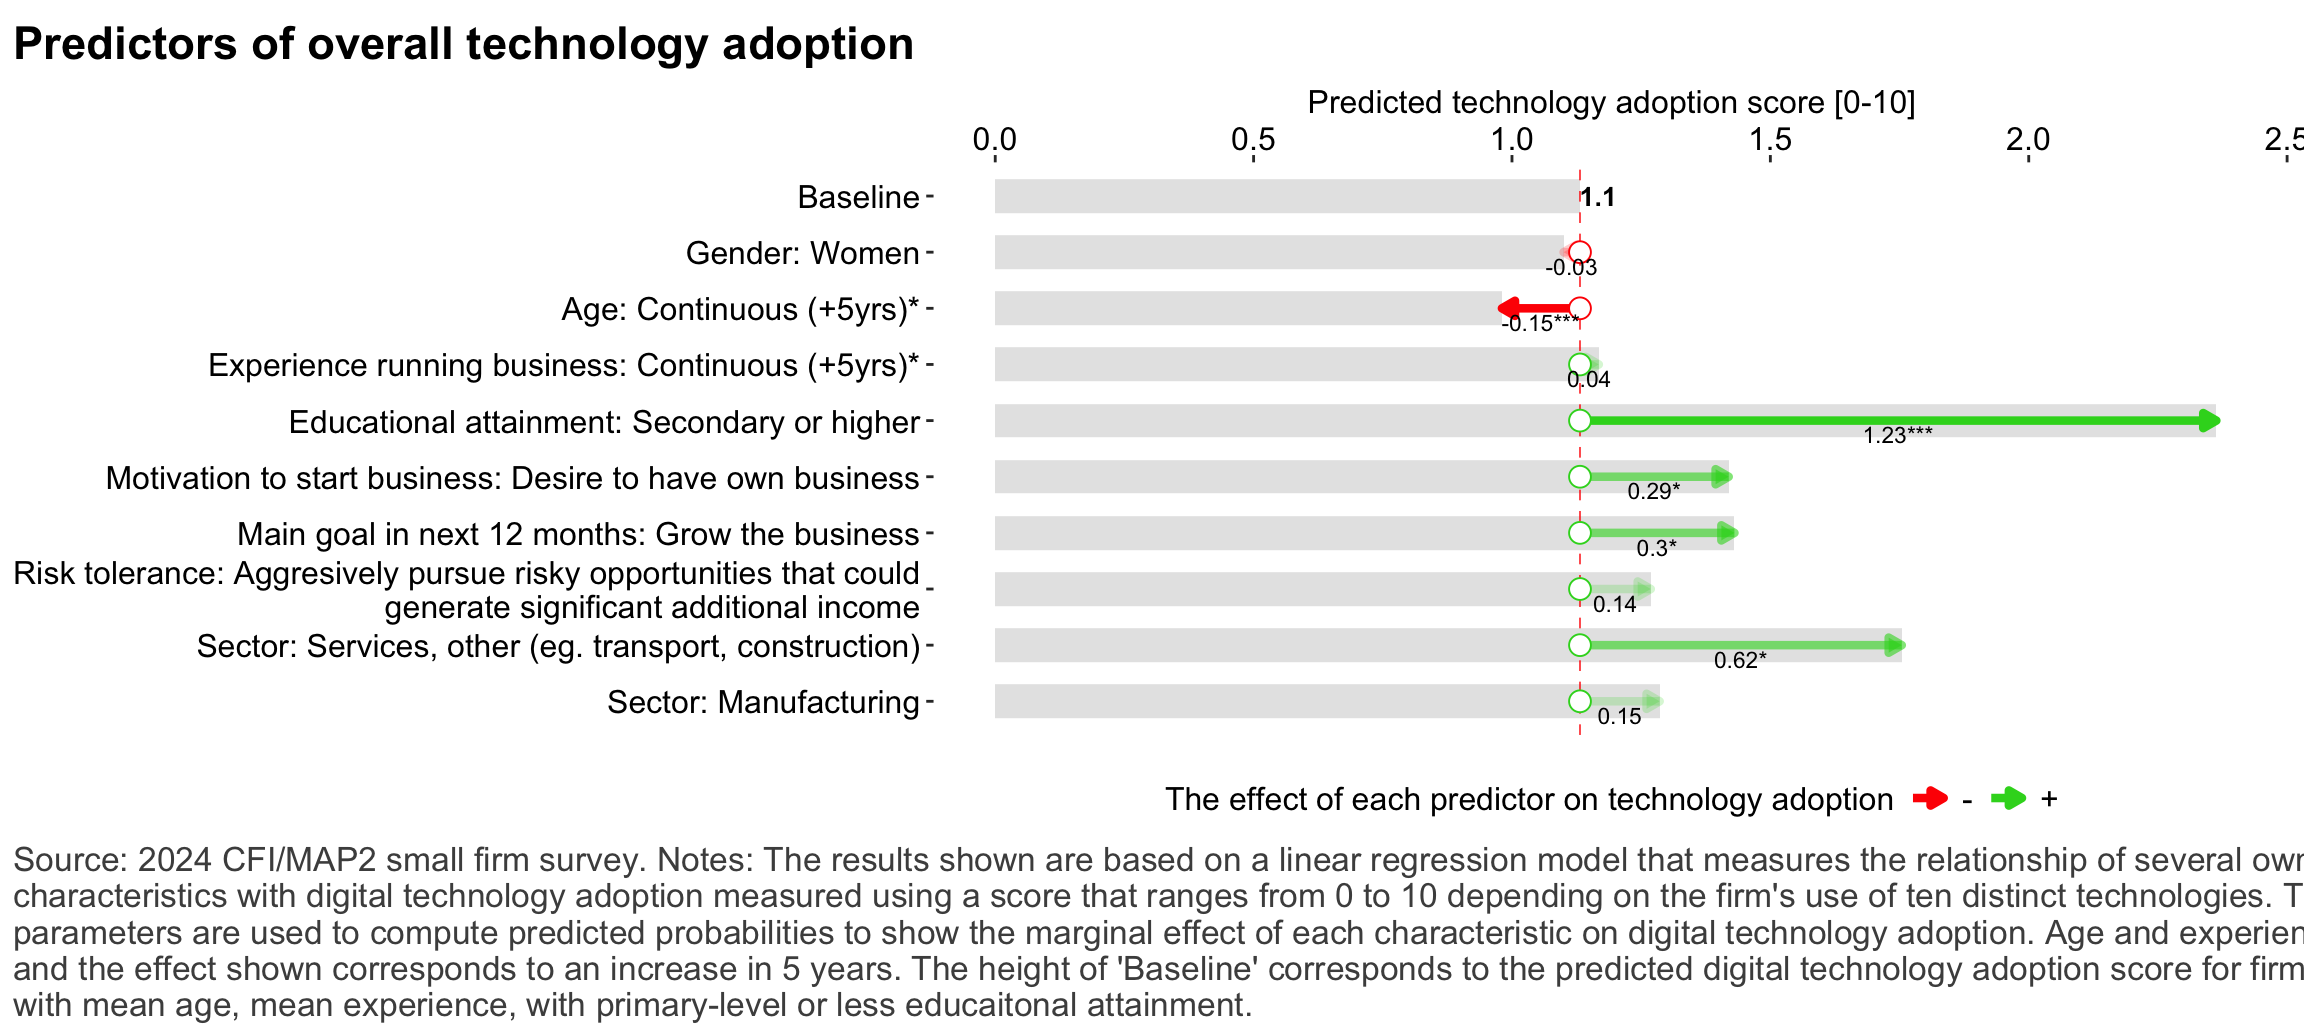
Figure 15: Predictors of digital technology adoption
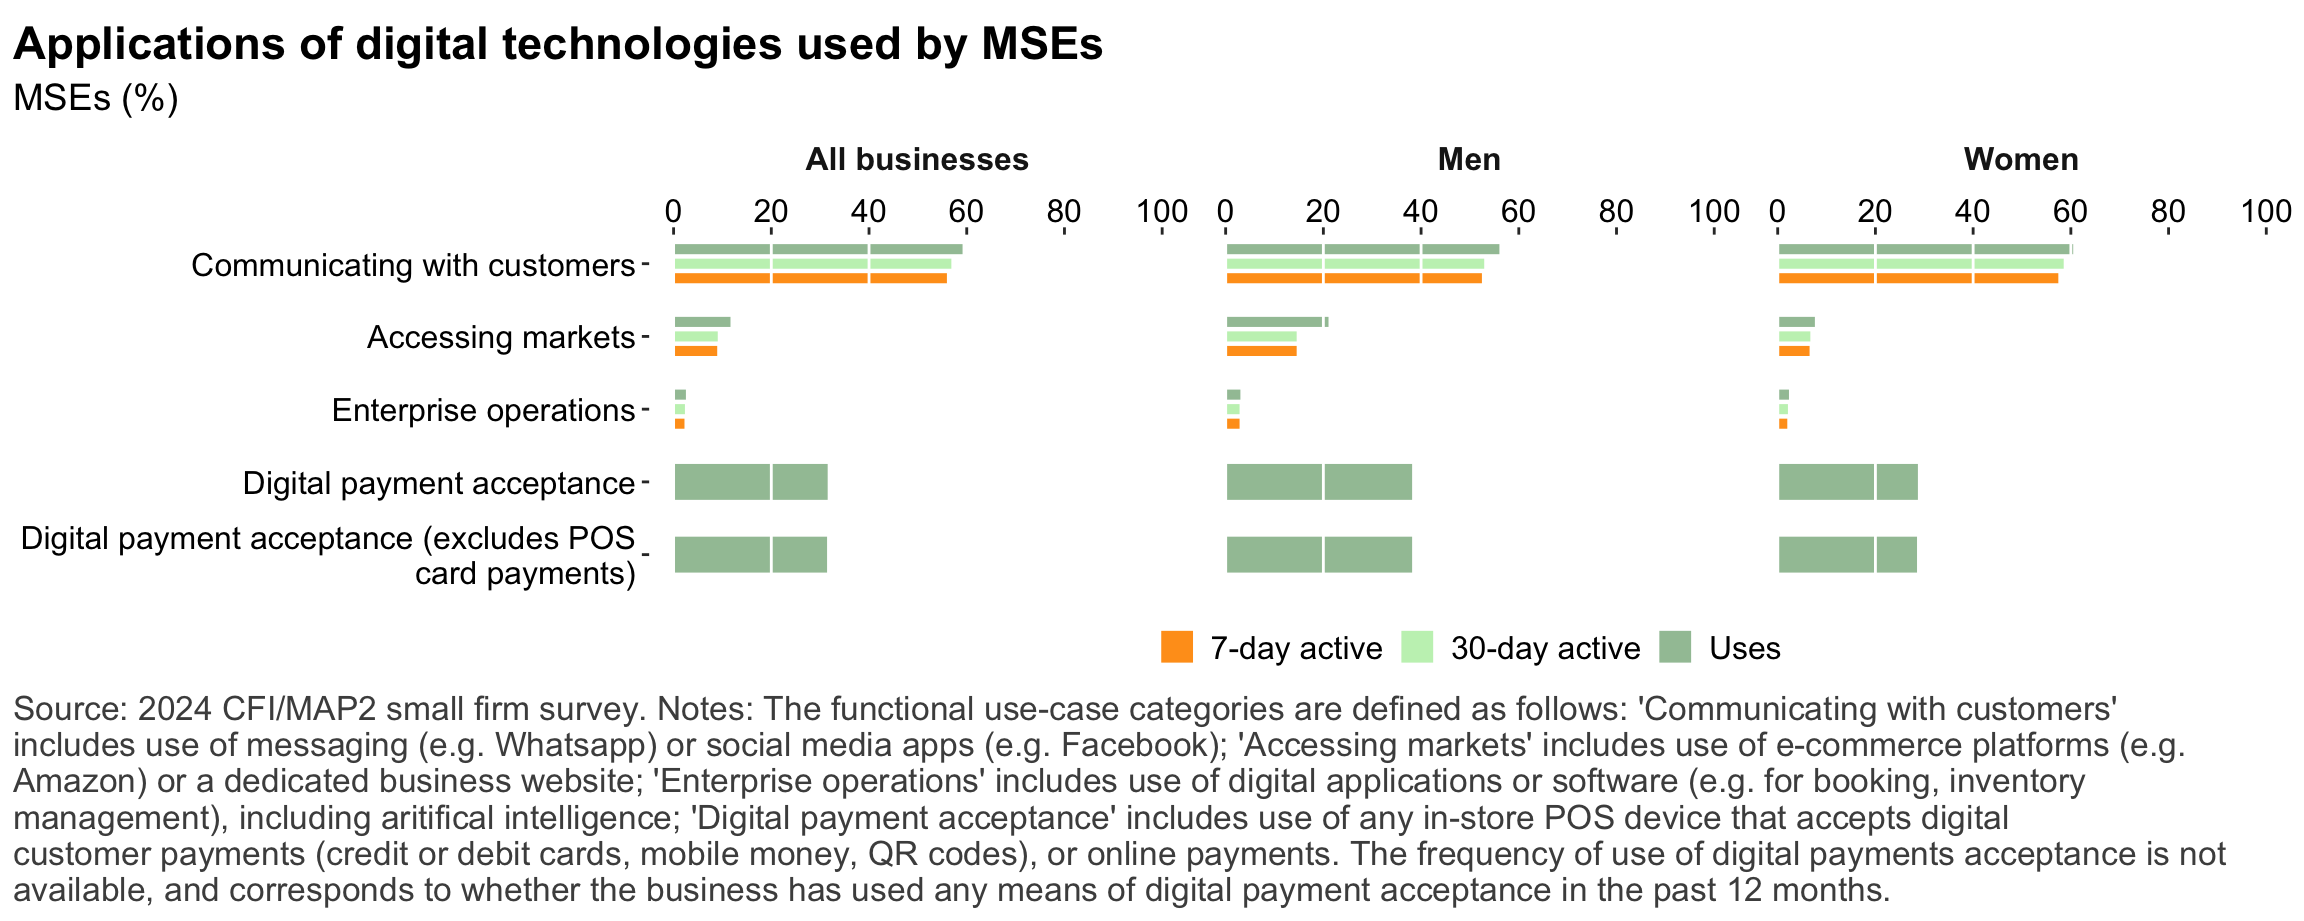
Figure 16: Digital technology adoption by use case
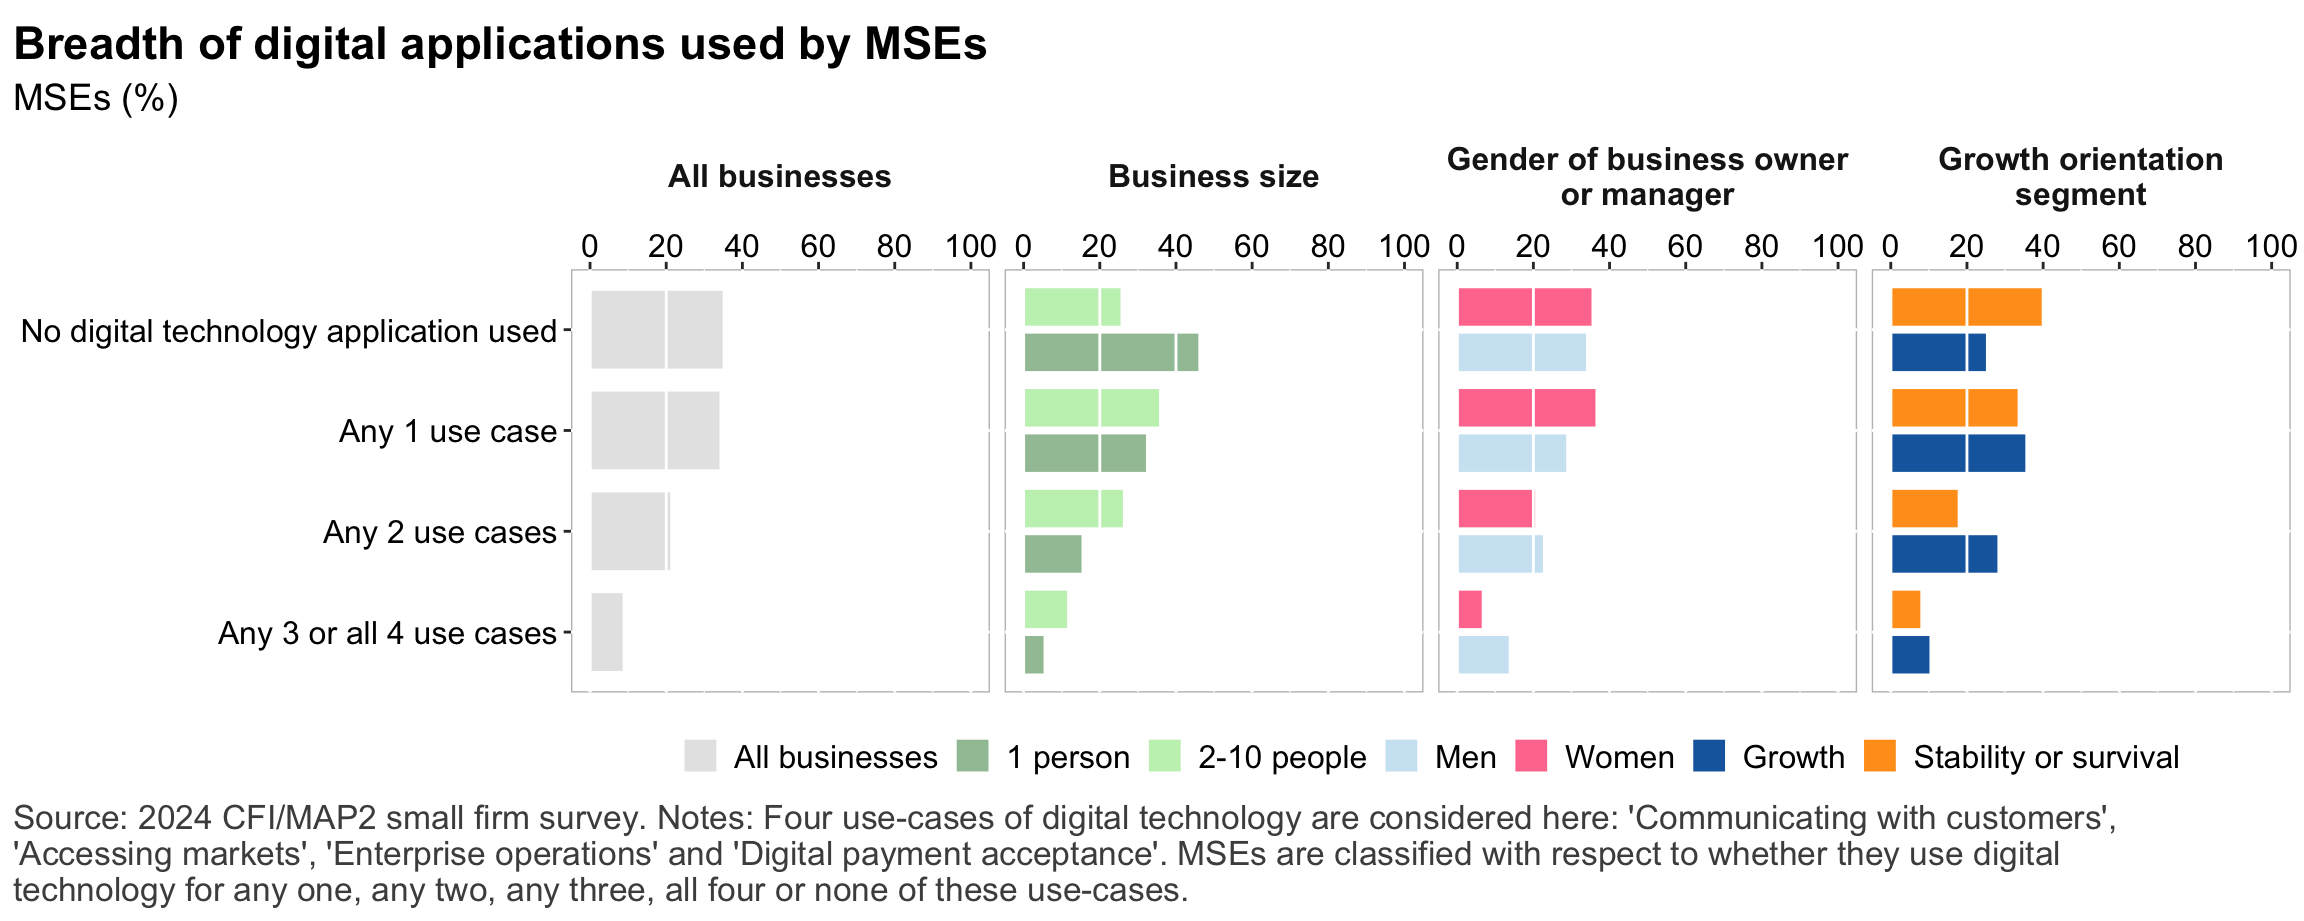
Figure 17: Depth of digital technology adoption
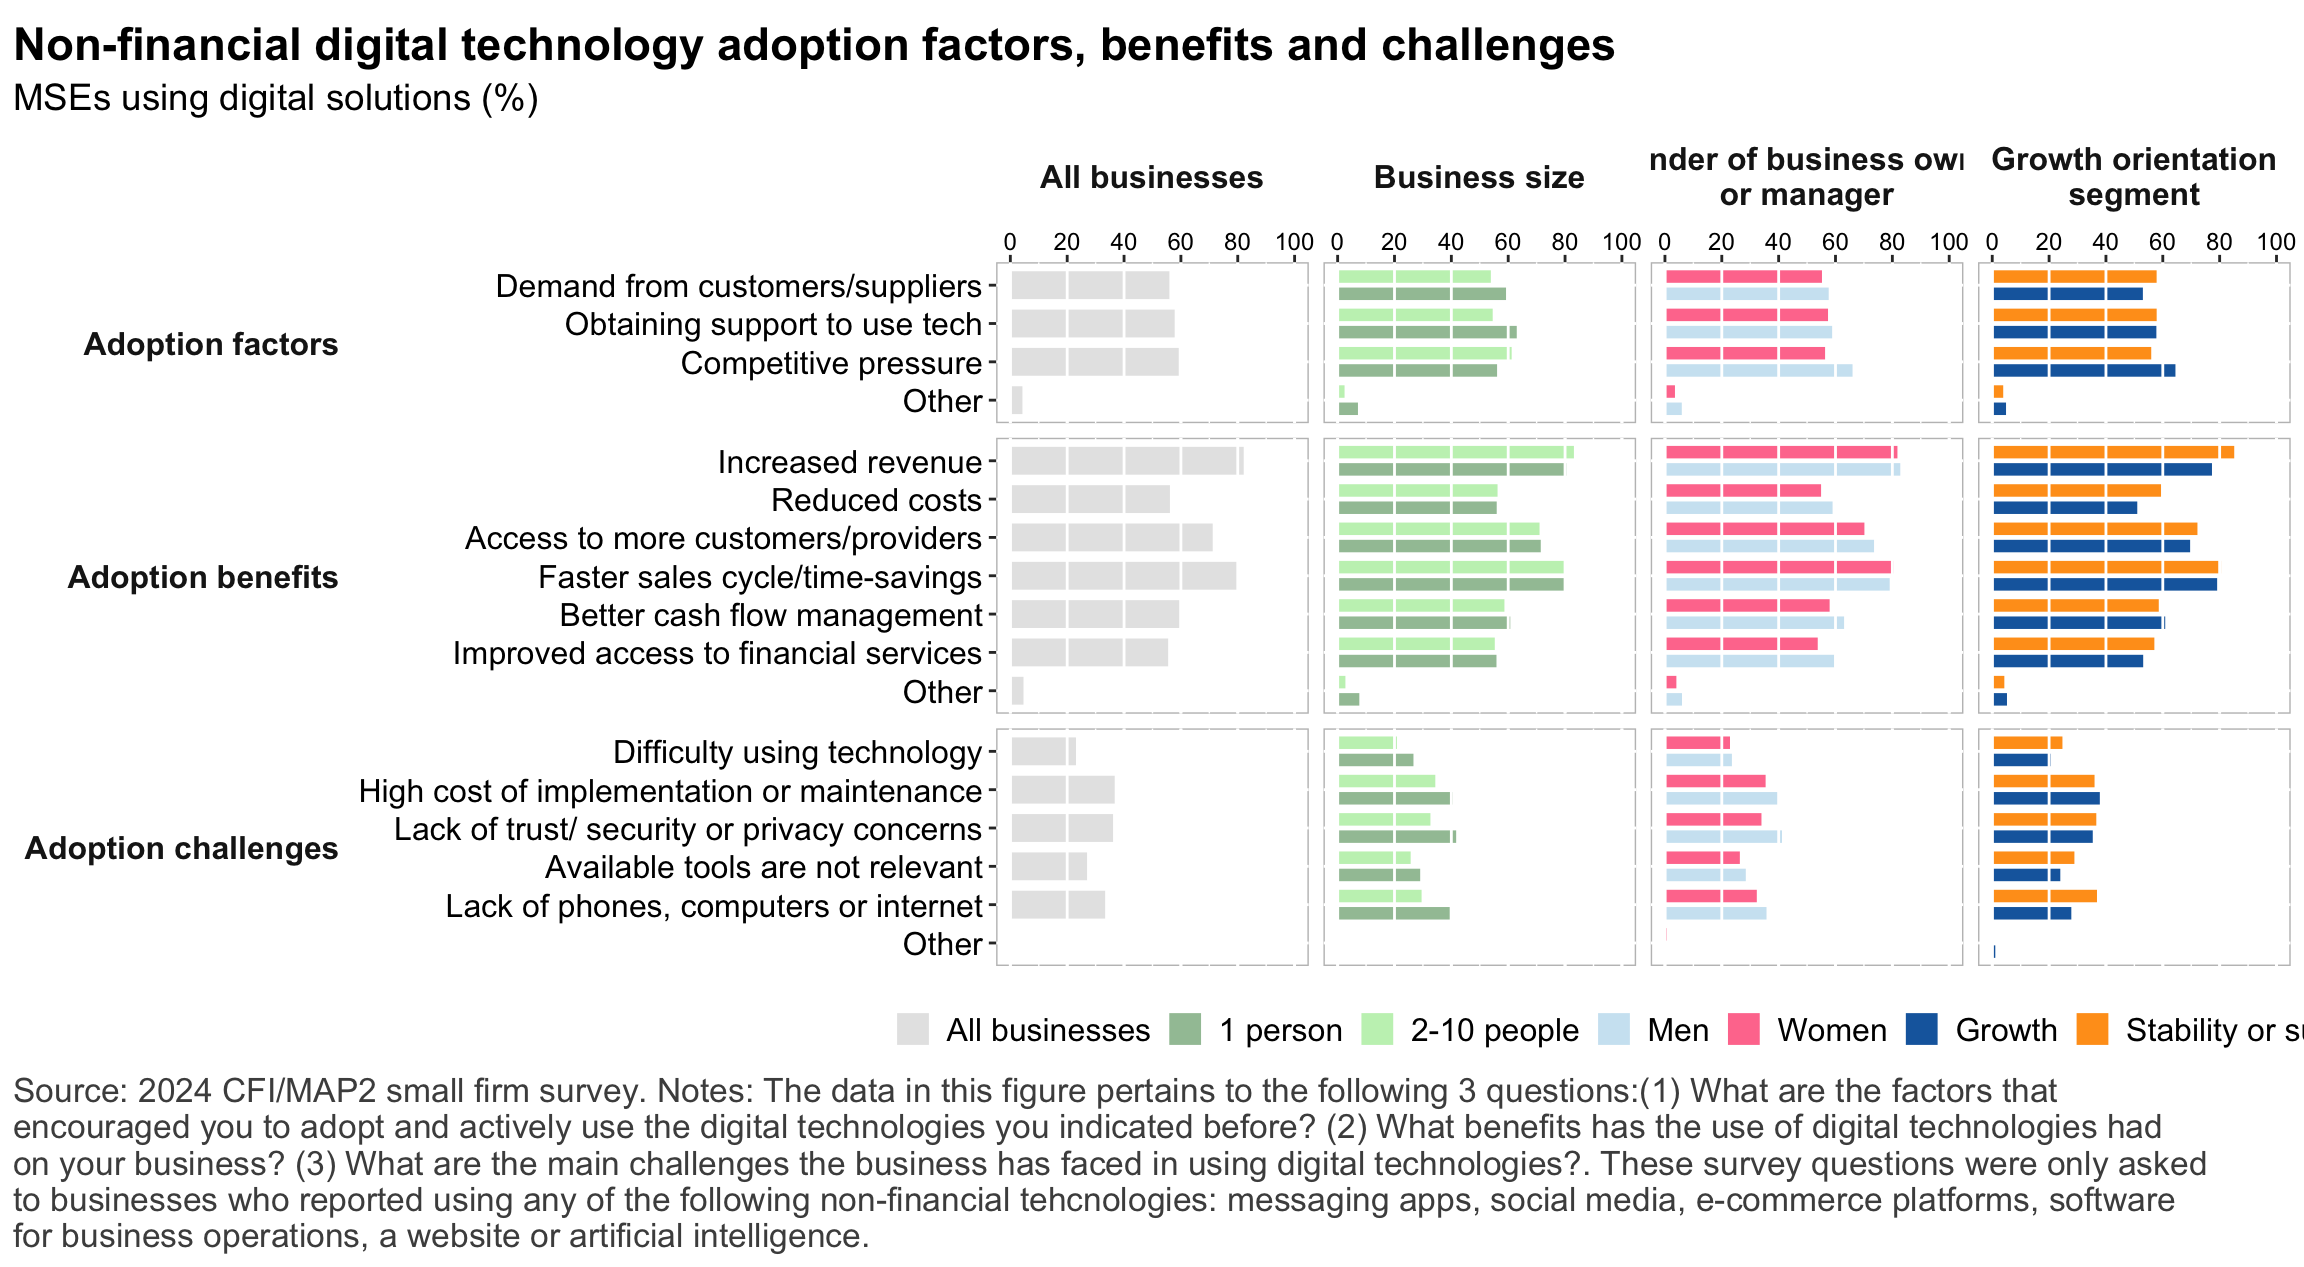
Figure 18: Digital technology adoption factors
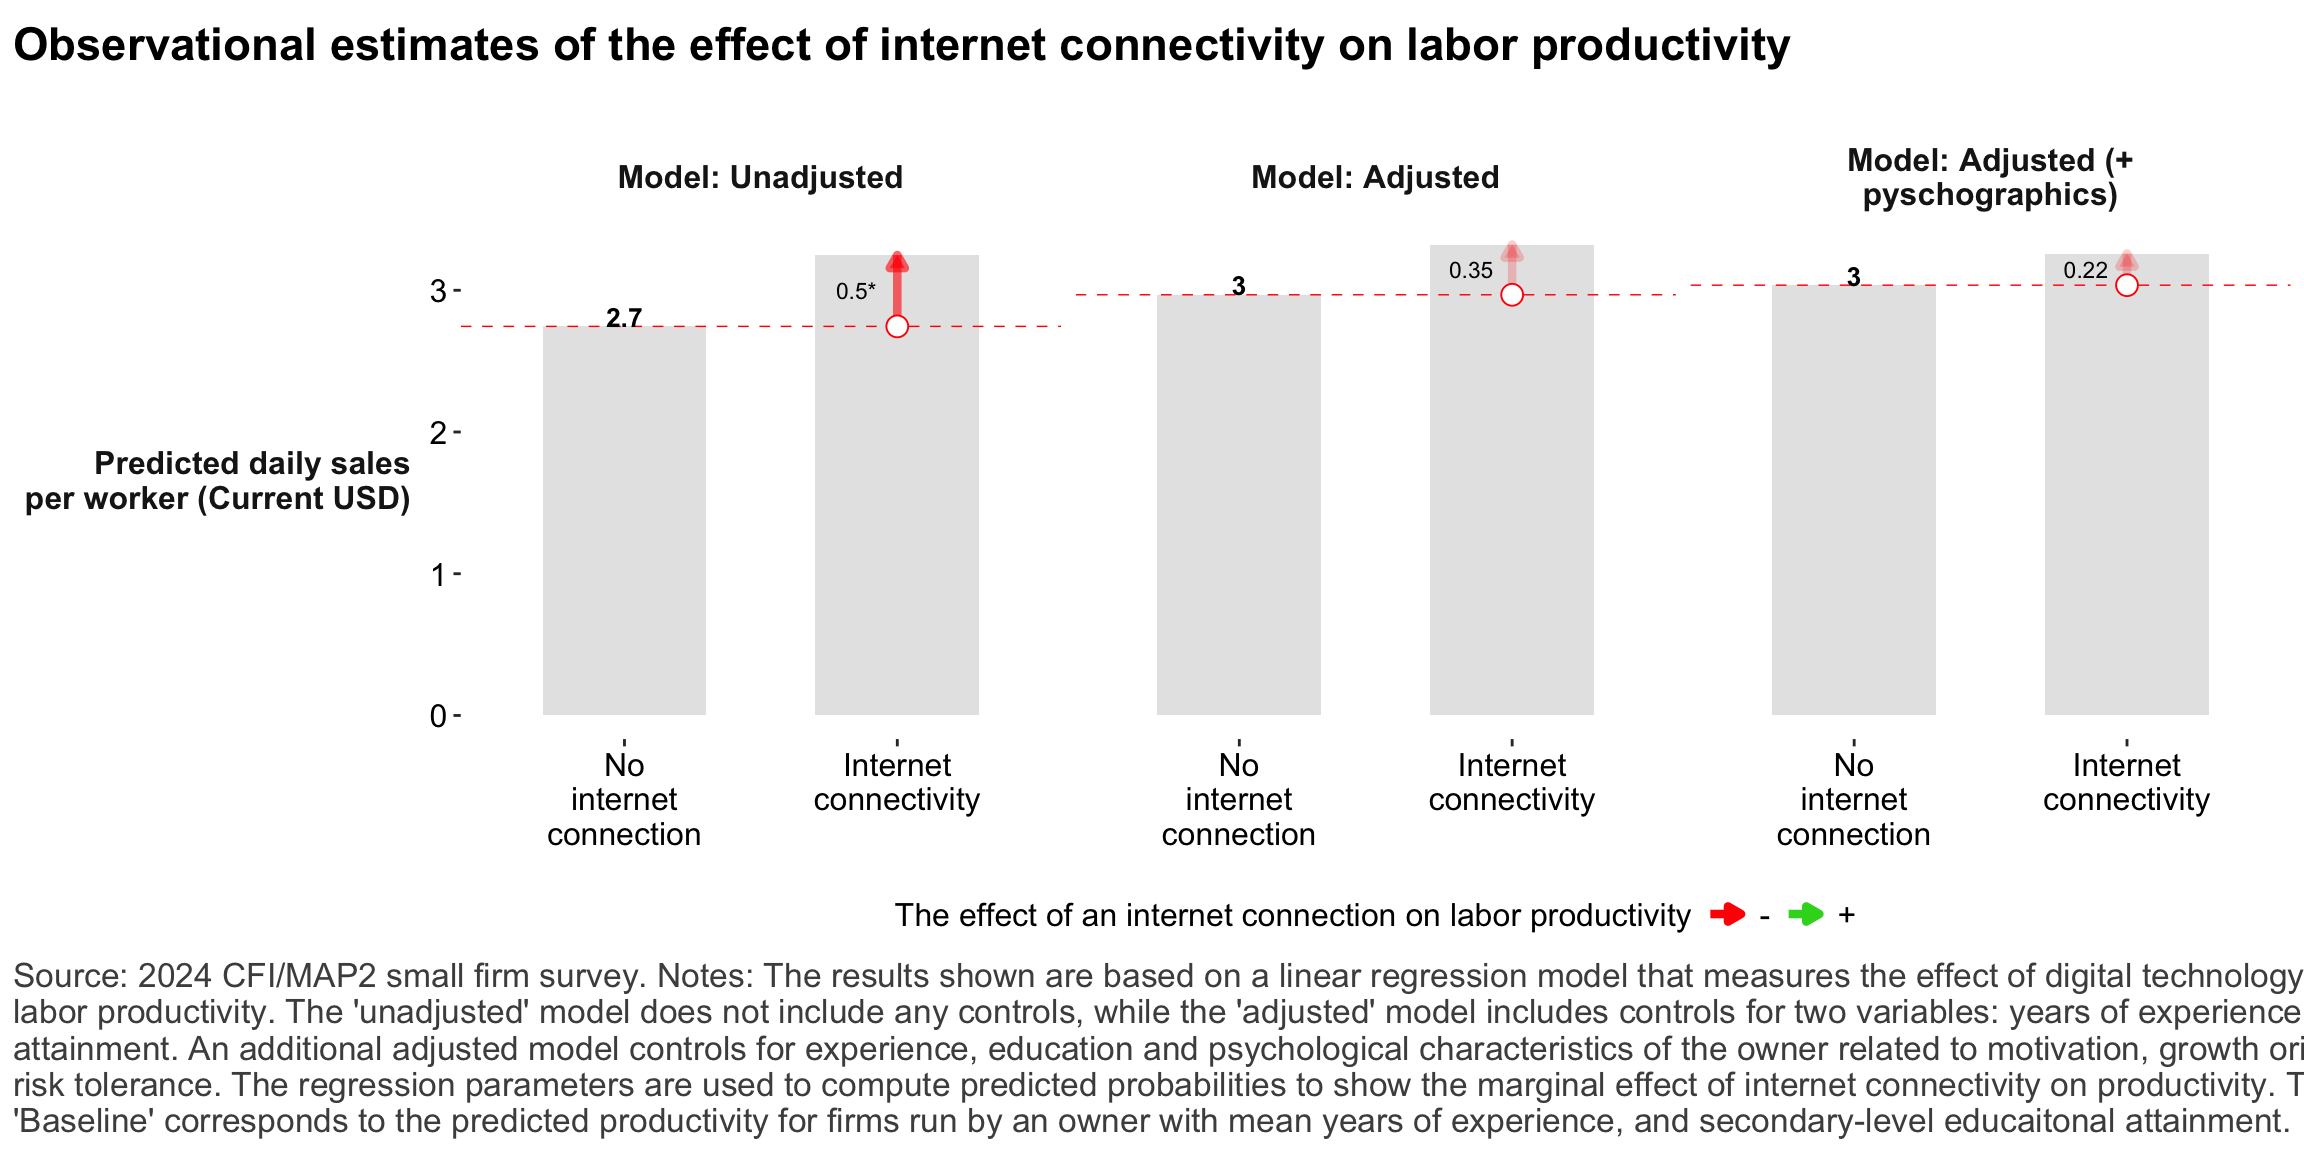
Figure 19: Relationship between internet-connectivity and firm-level labor productivity
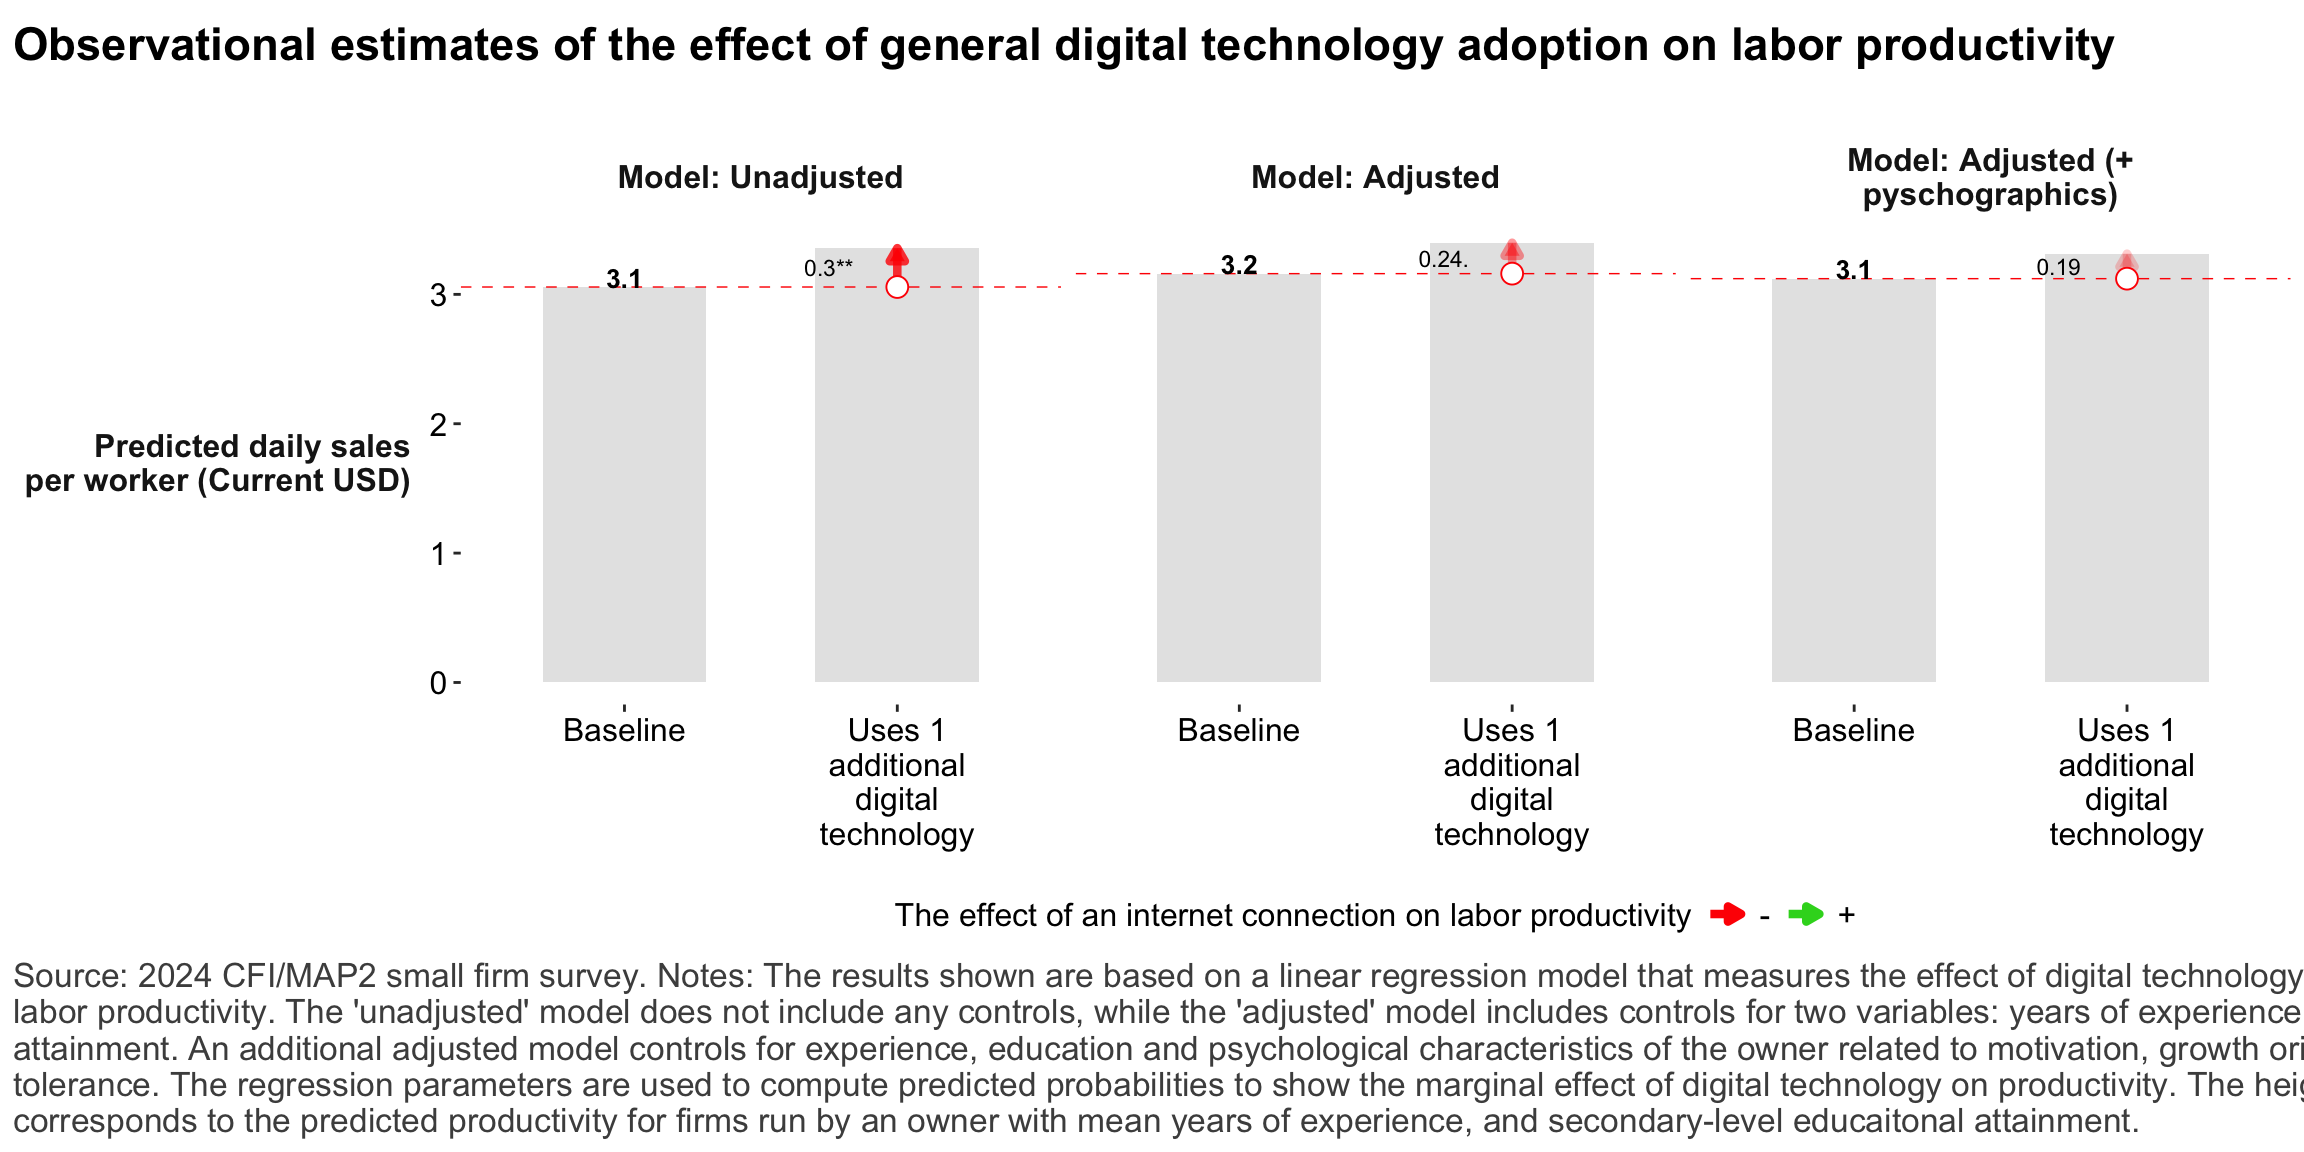
Figure 20: Relationship between digital technology and firm-level labor productivity
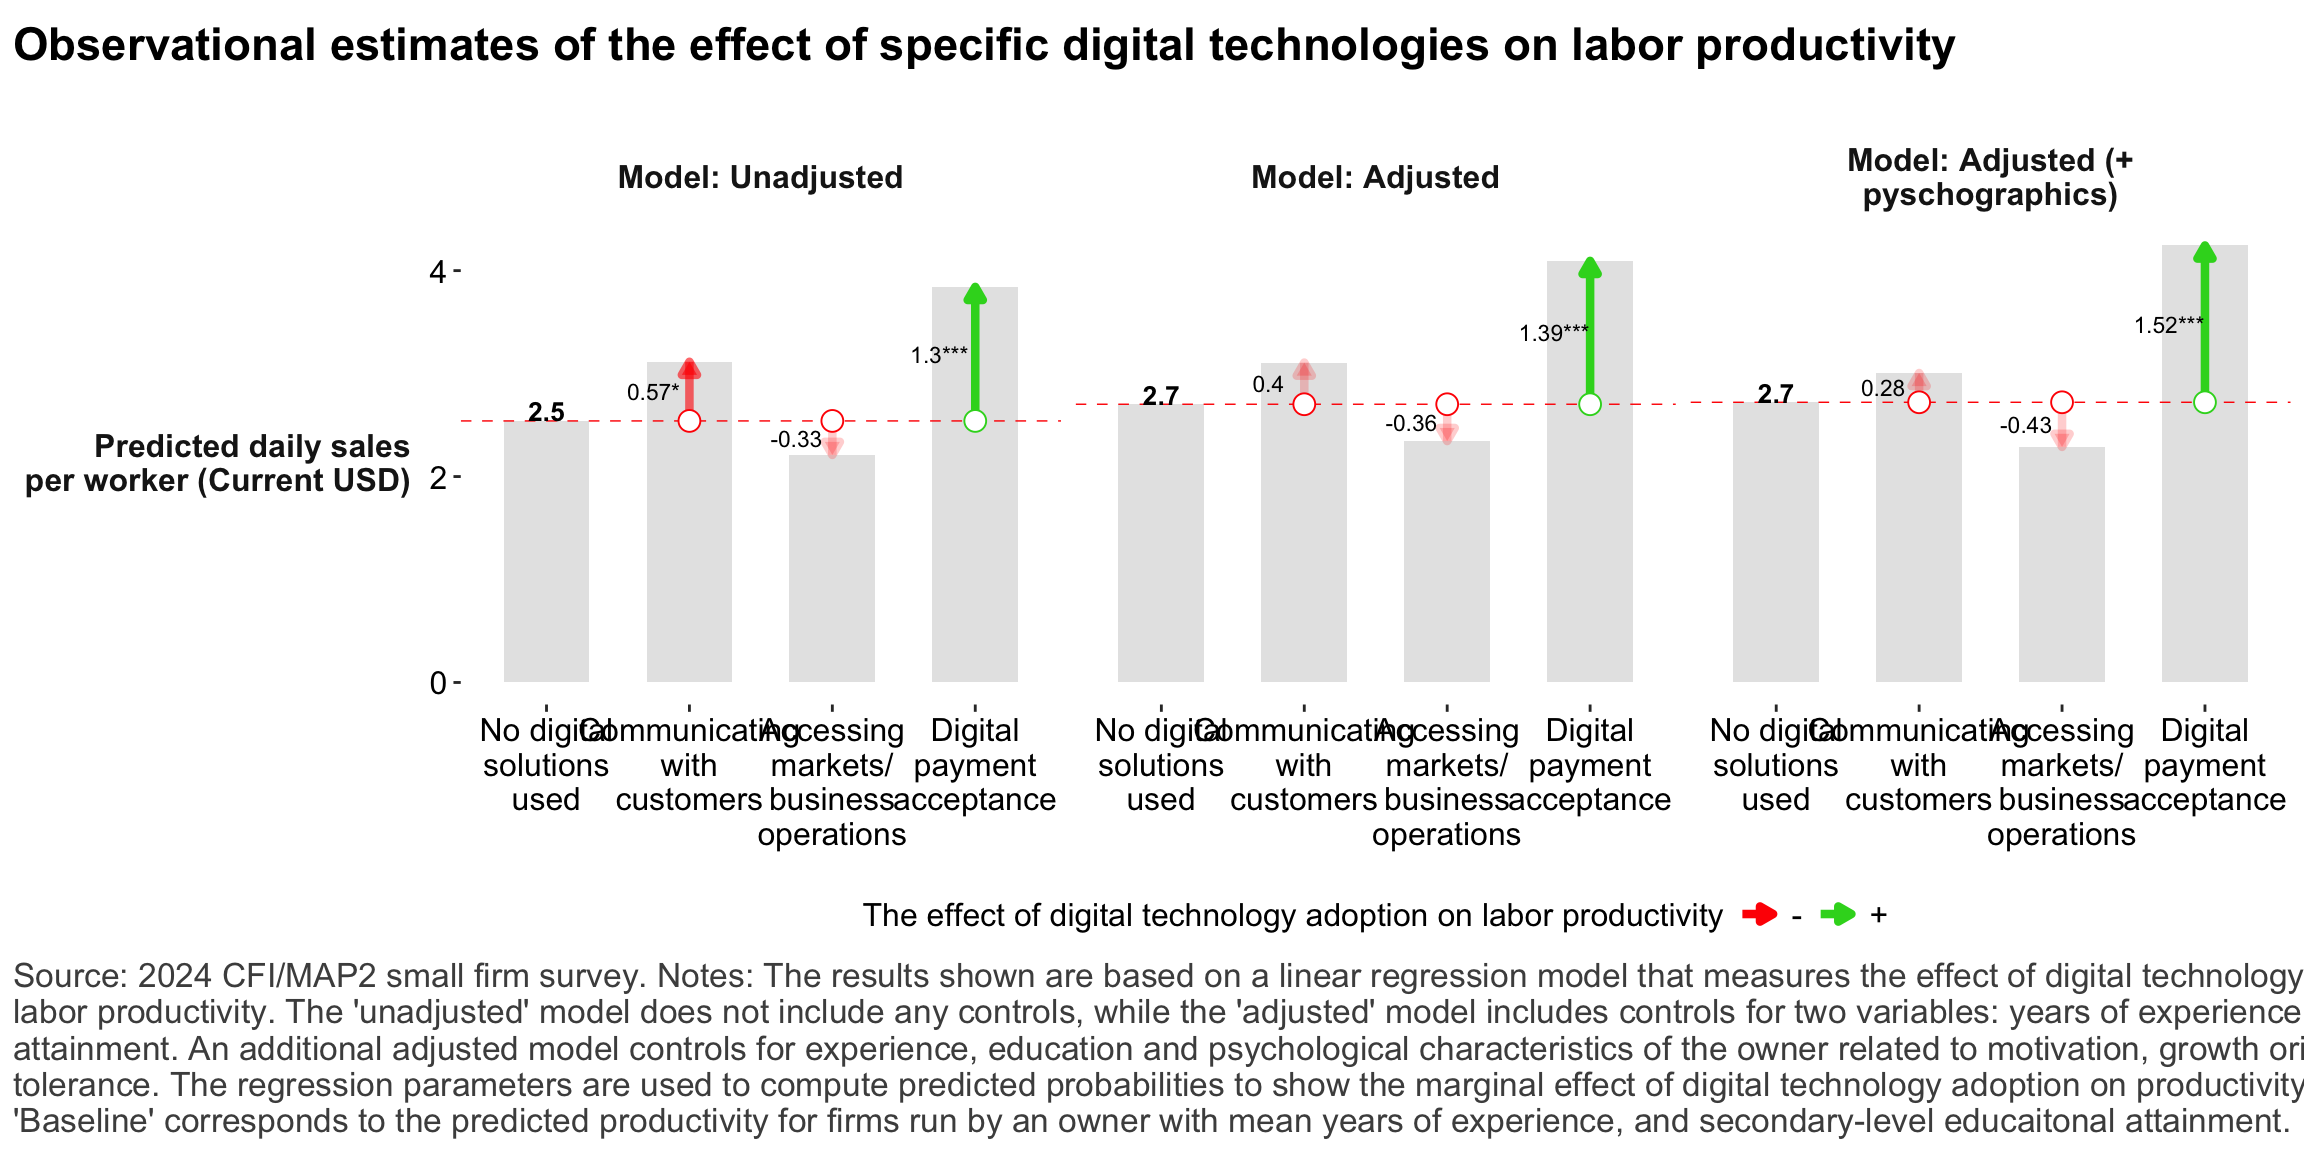
Figure 21: Relationship between digital technology adoption and firm-level labor productivity
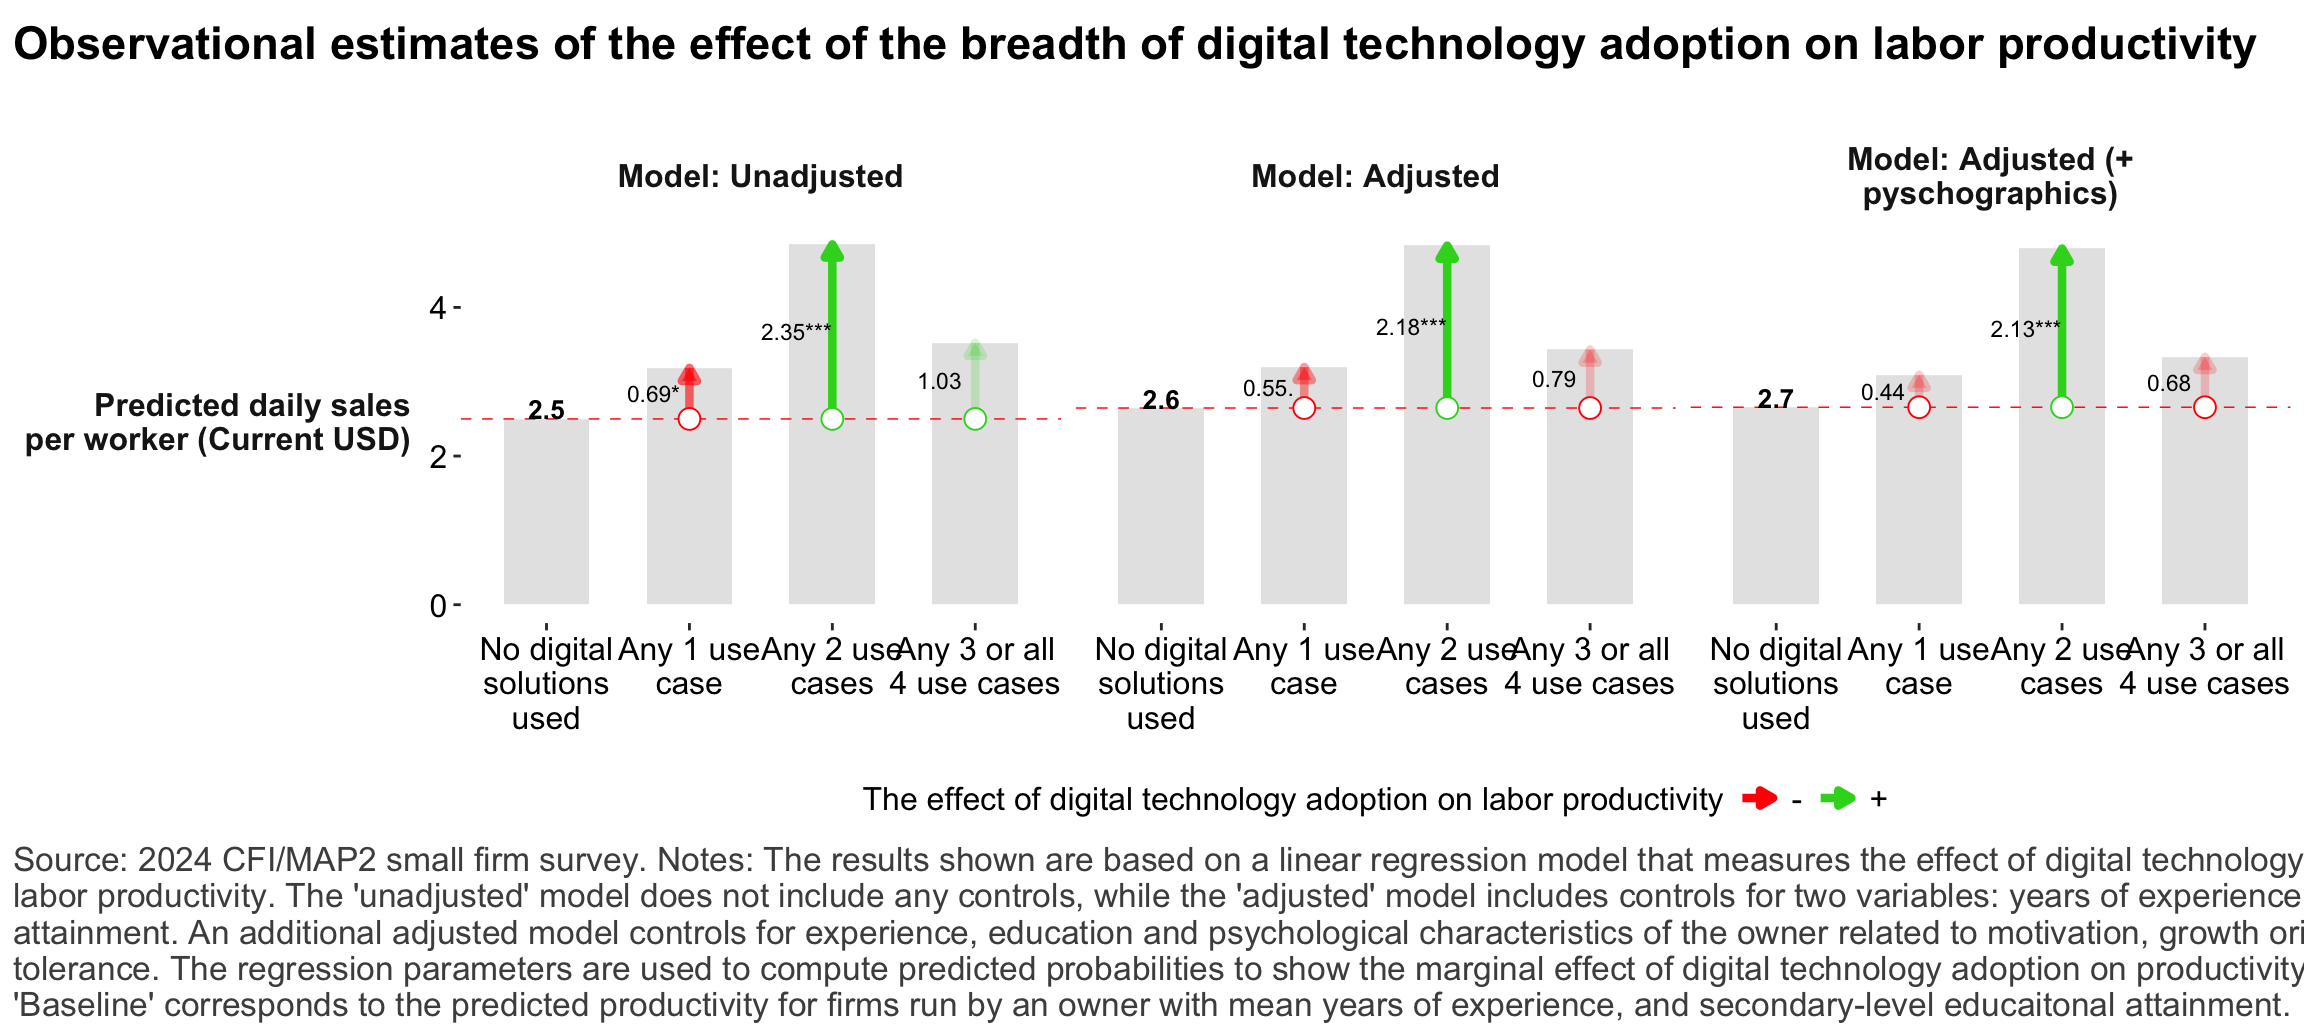
Figure 22: Relationship between breadth of digital technology adoption and firm-level labor productivity
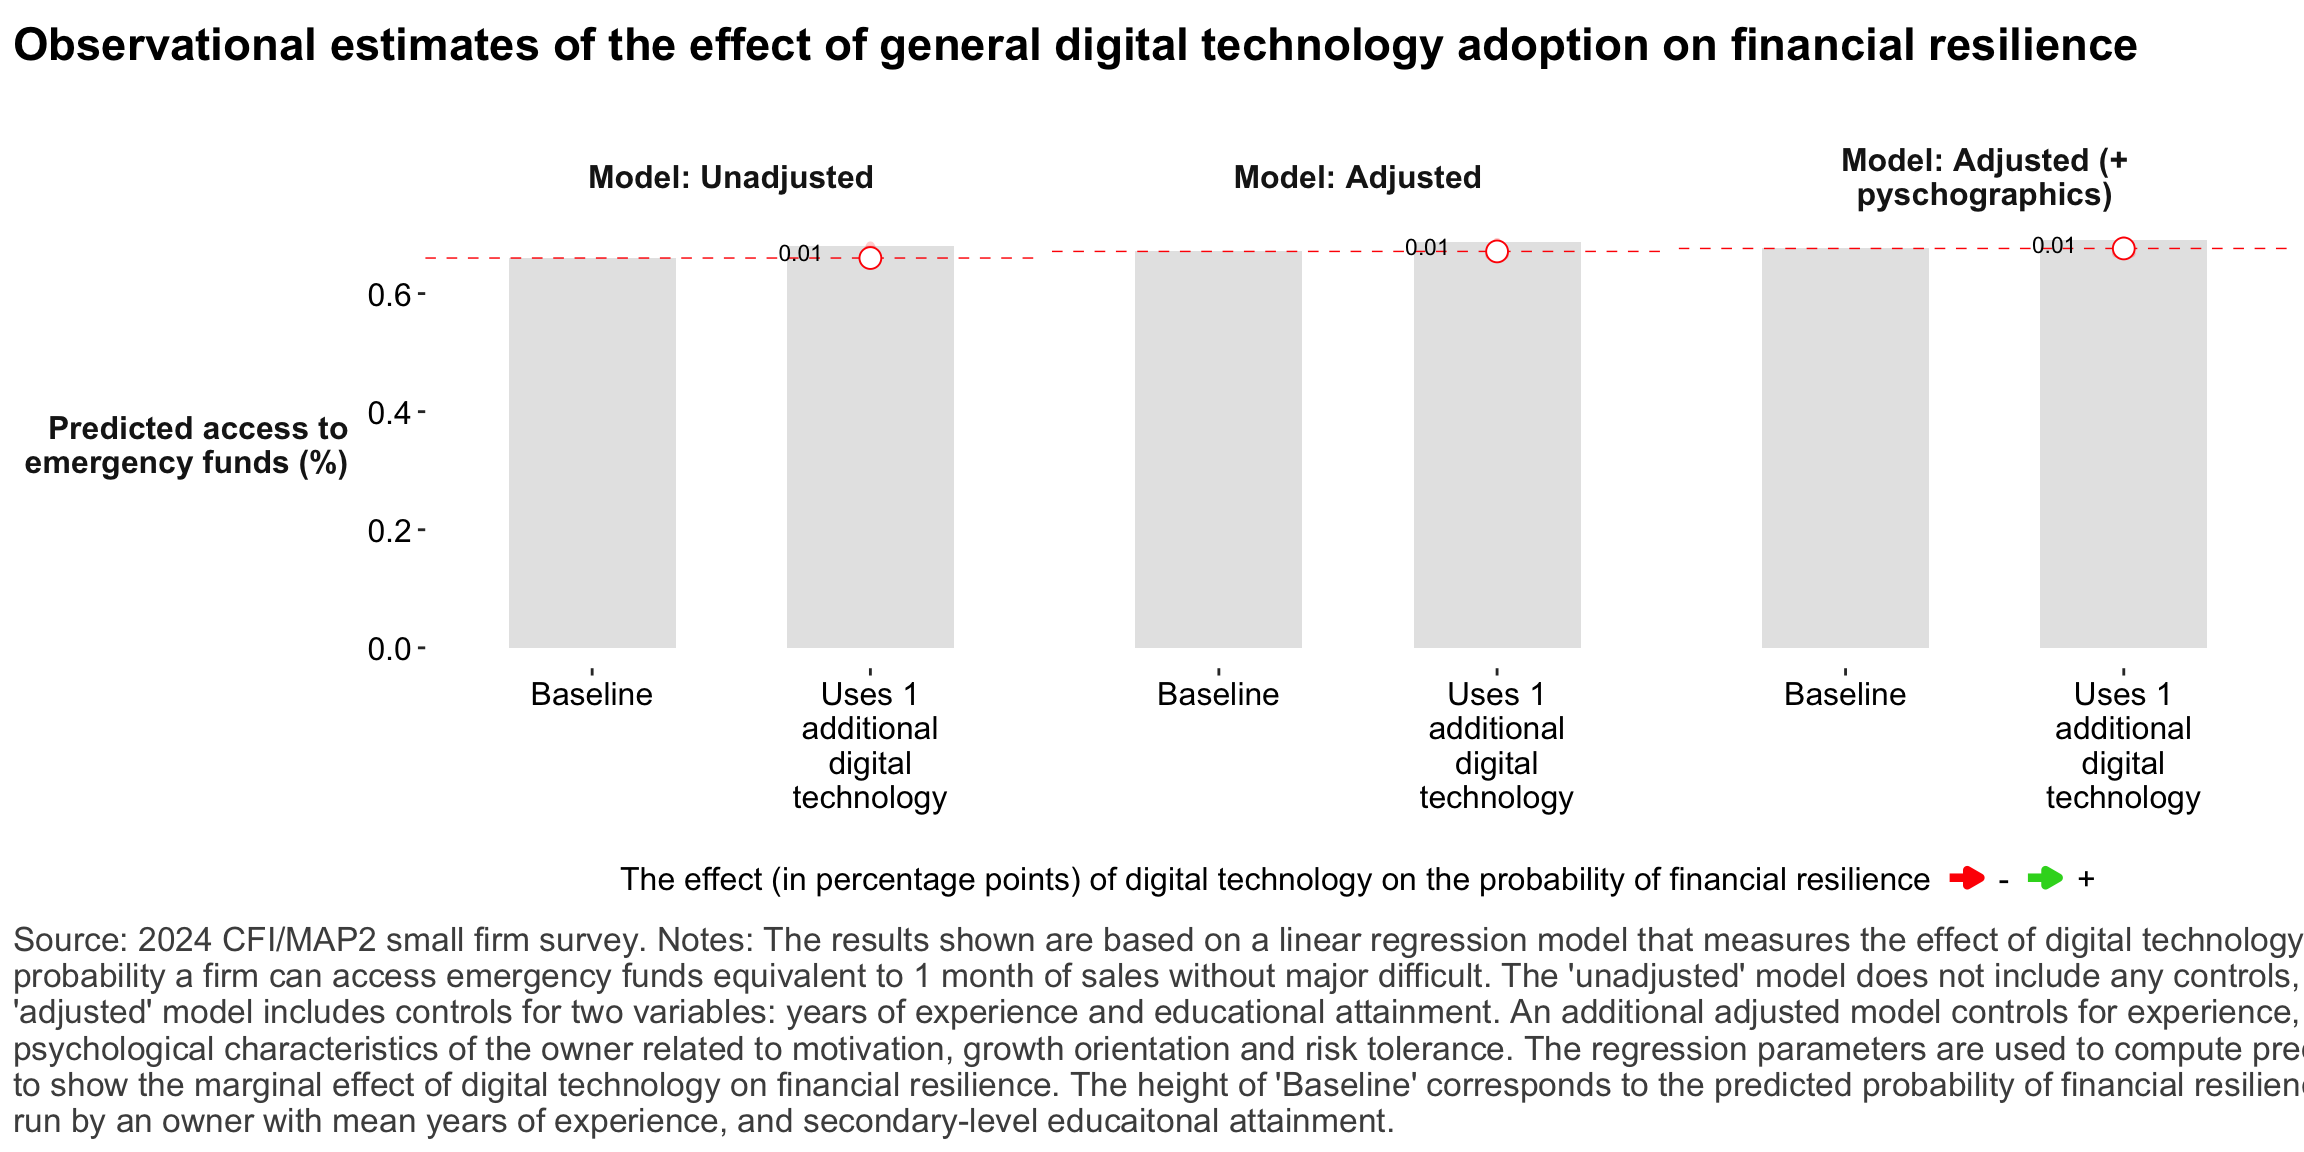
Figure 23: Relationship between digital technology and financial resilience
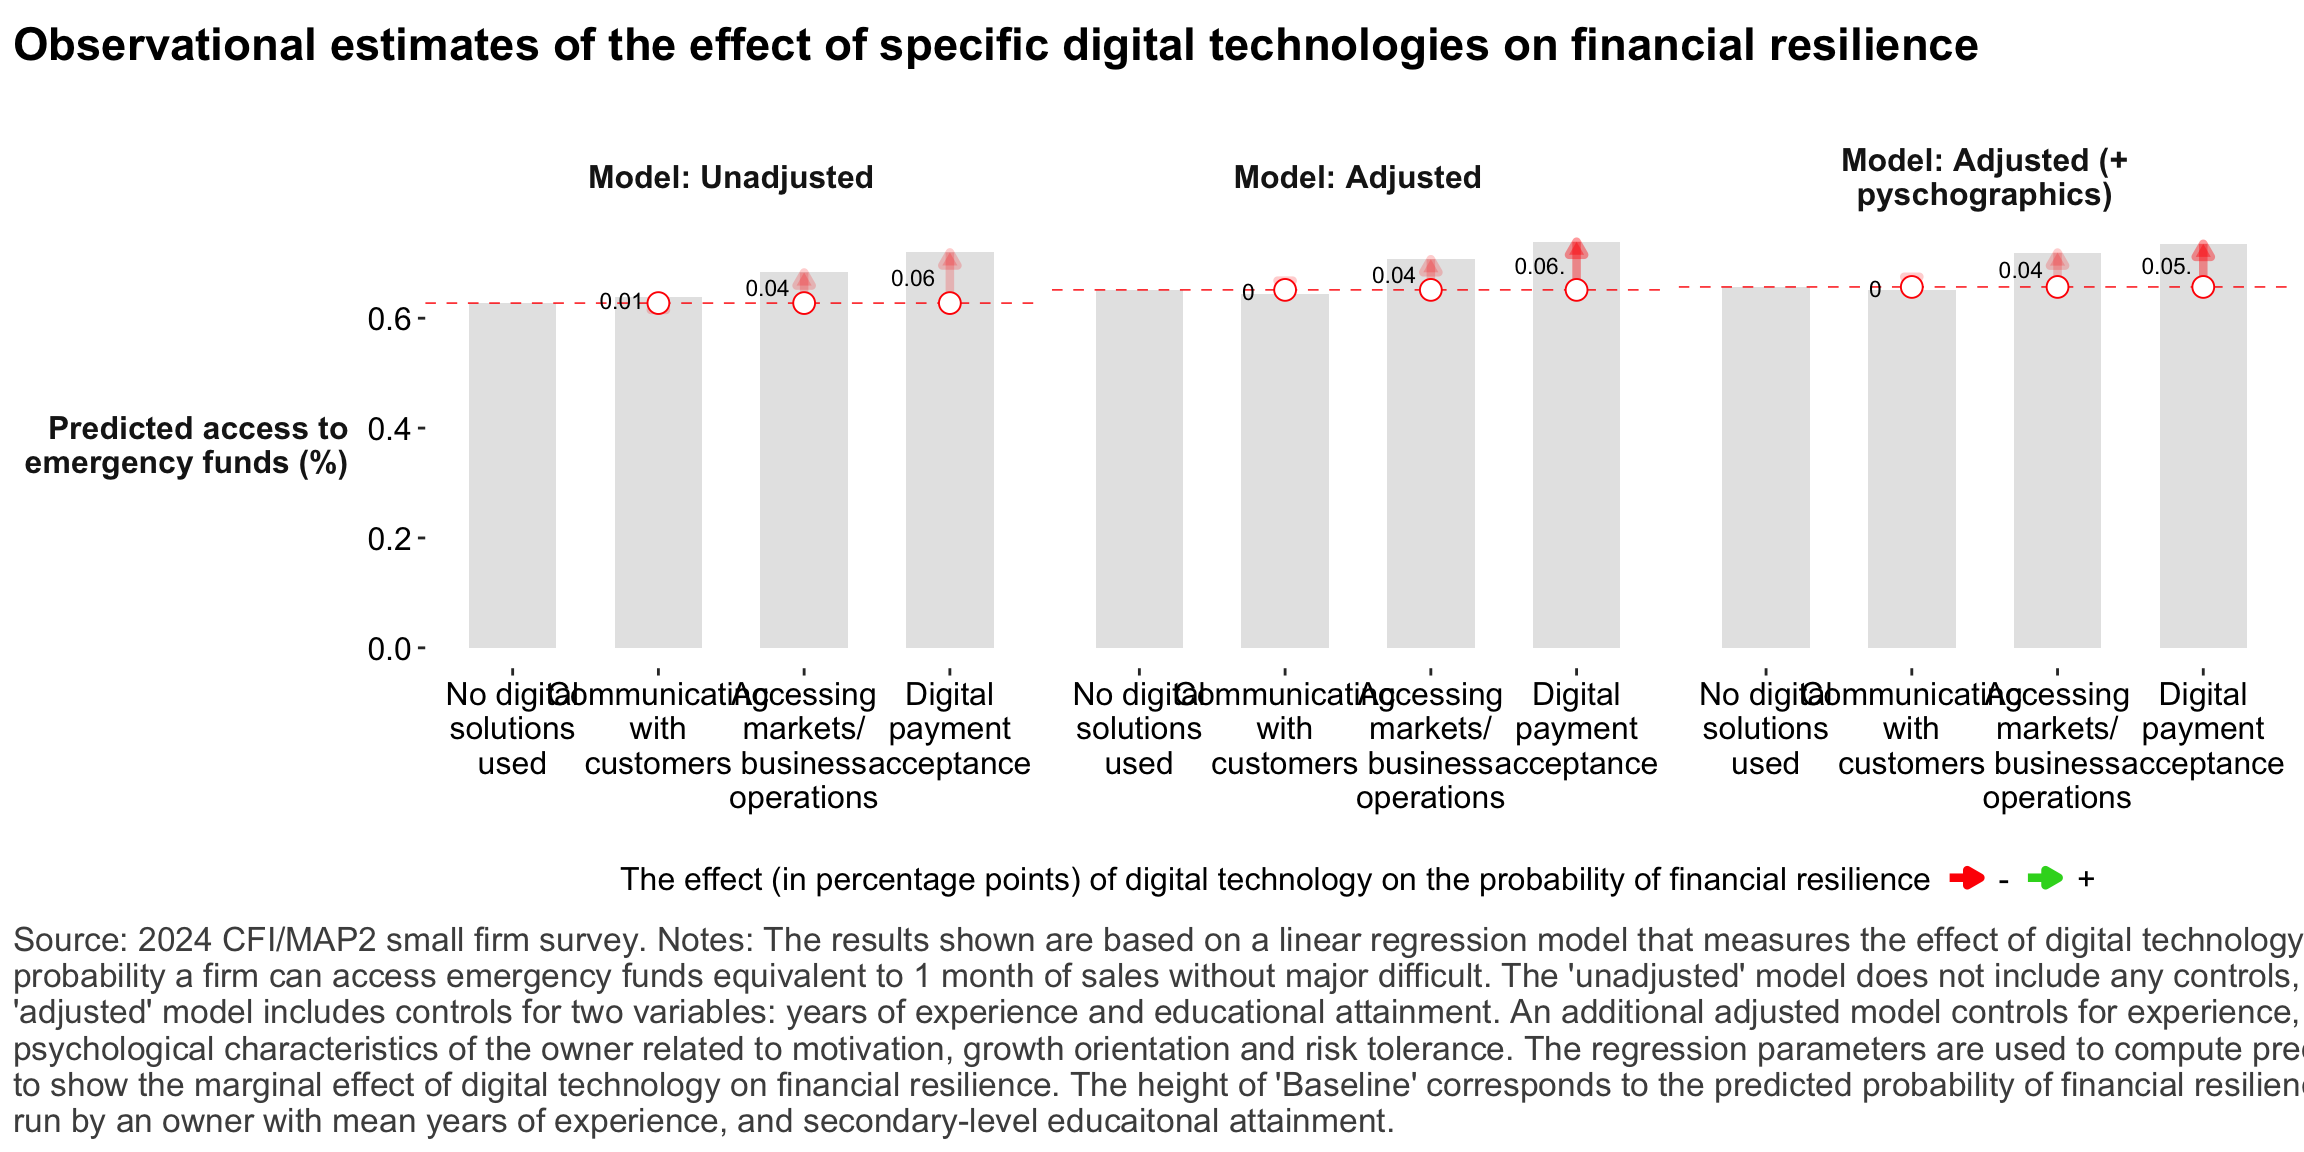
Figure 24: Relationship between digital technology adoption and financial resilience
Financial services
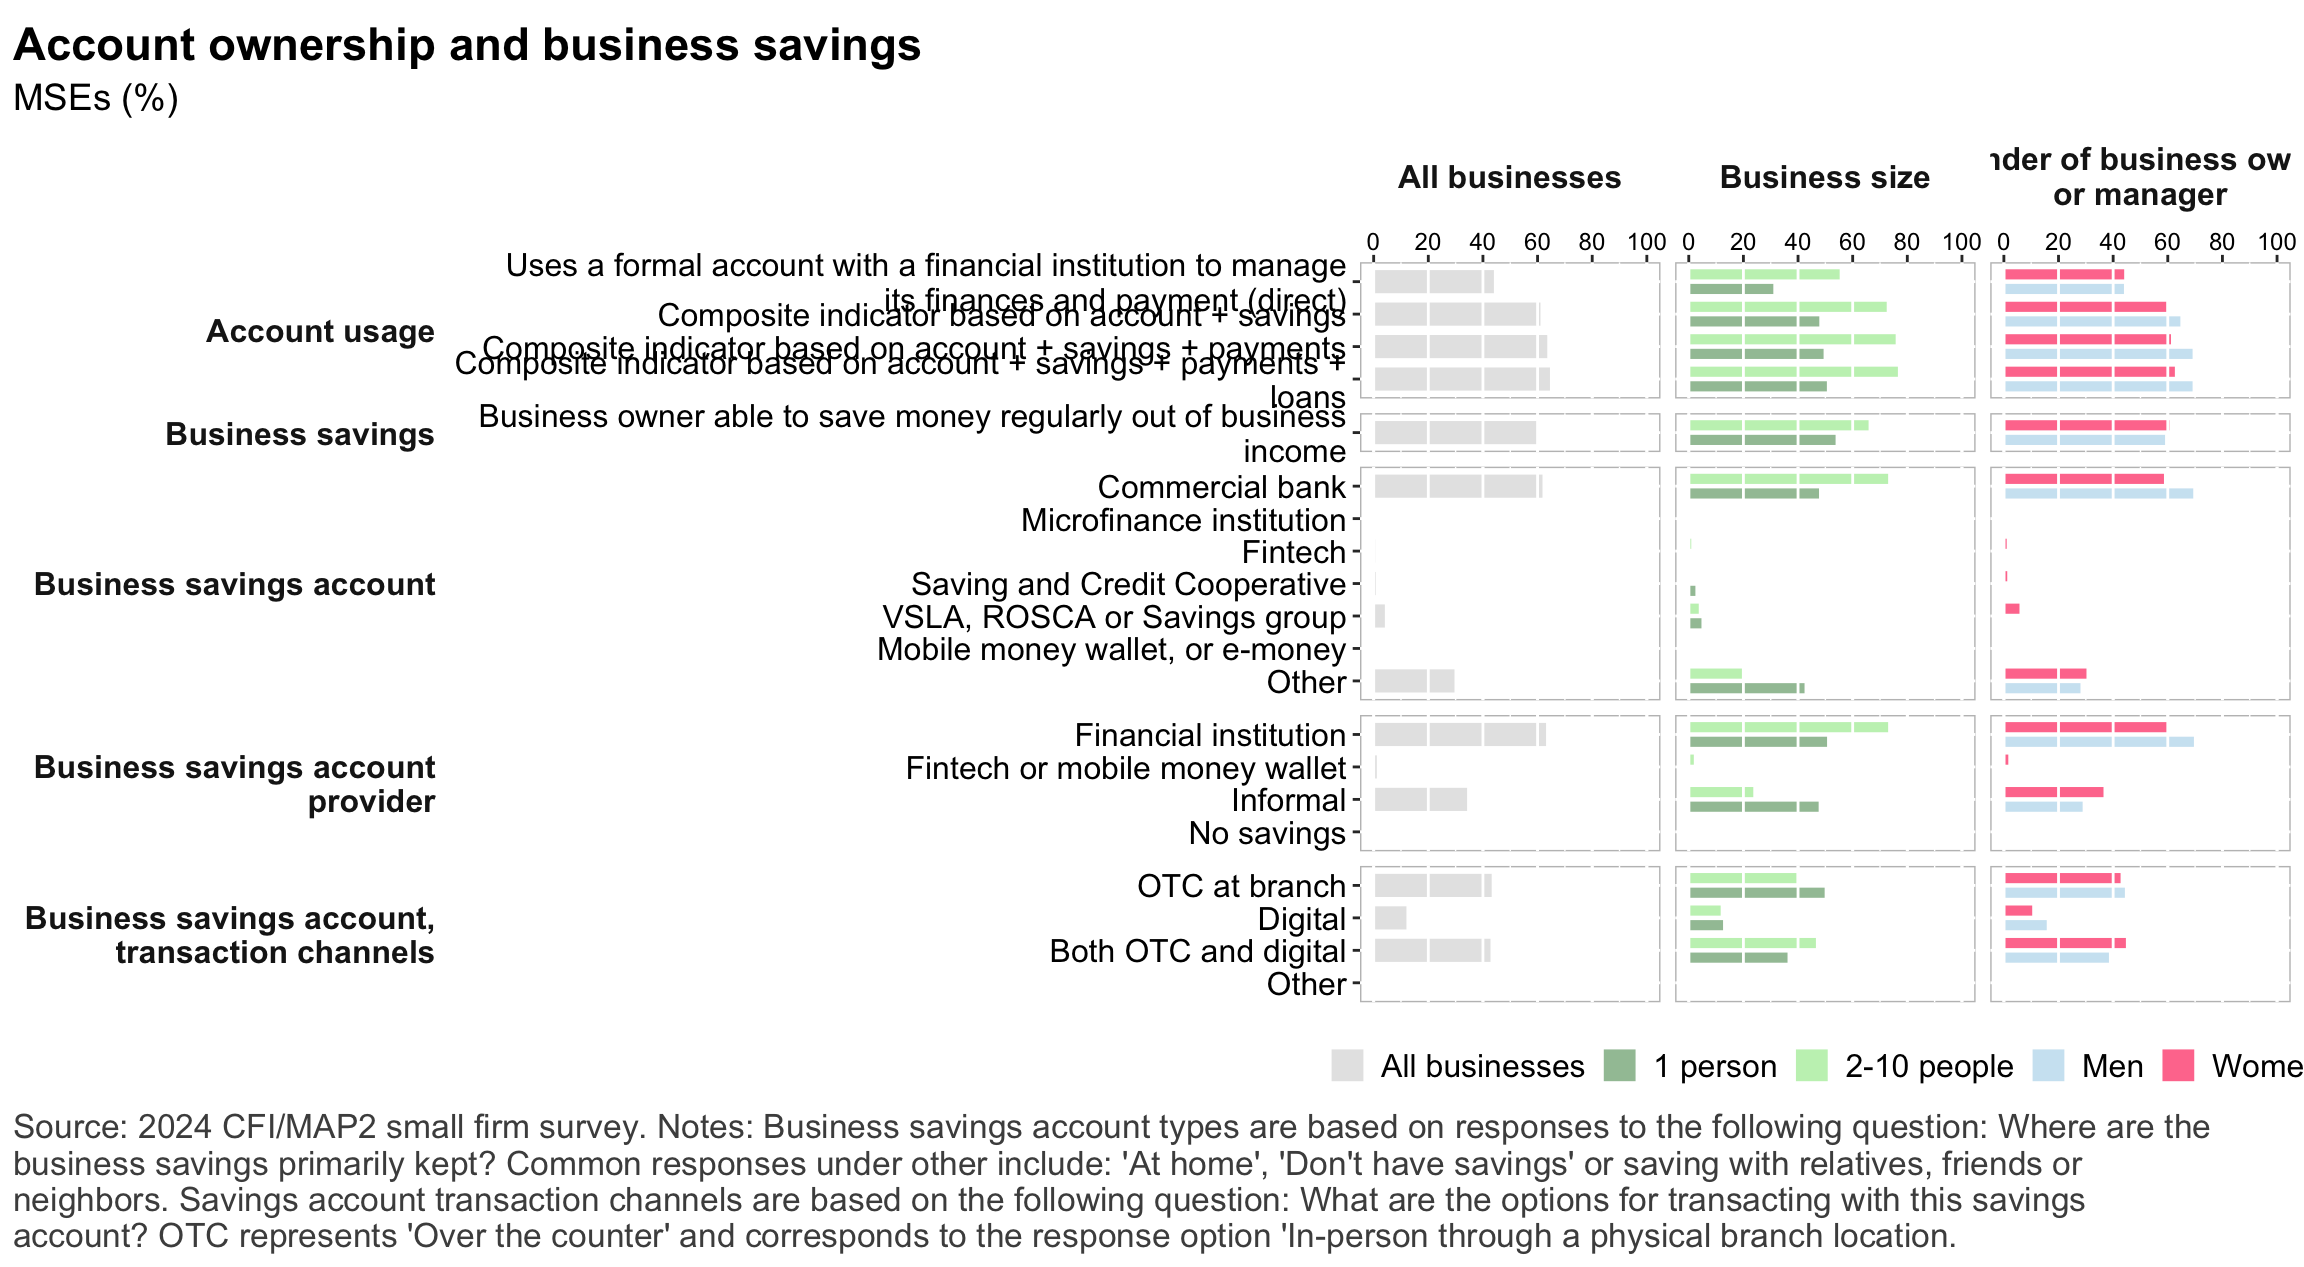
Figure 25: Financical accounts and savings
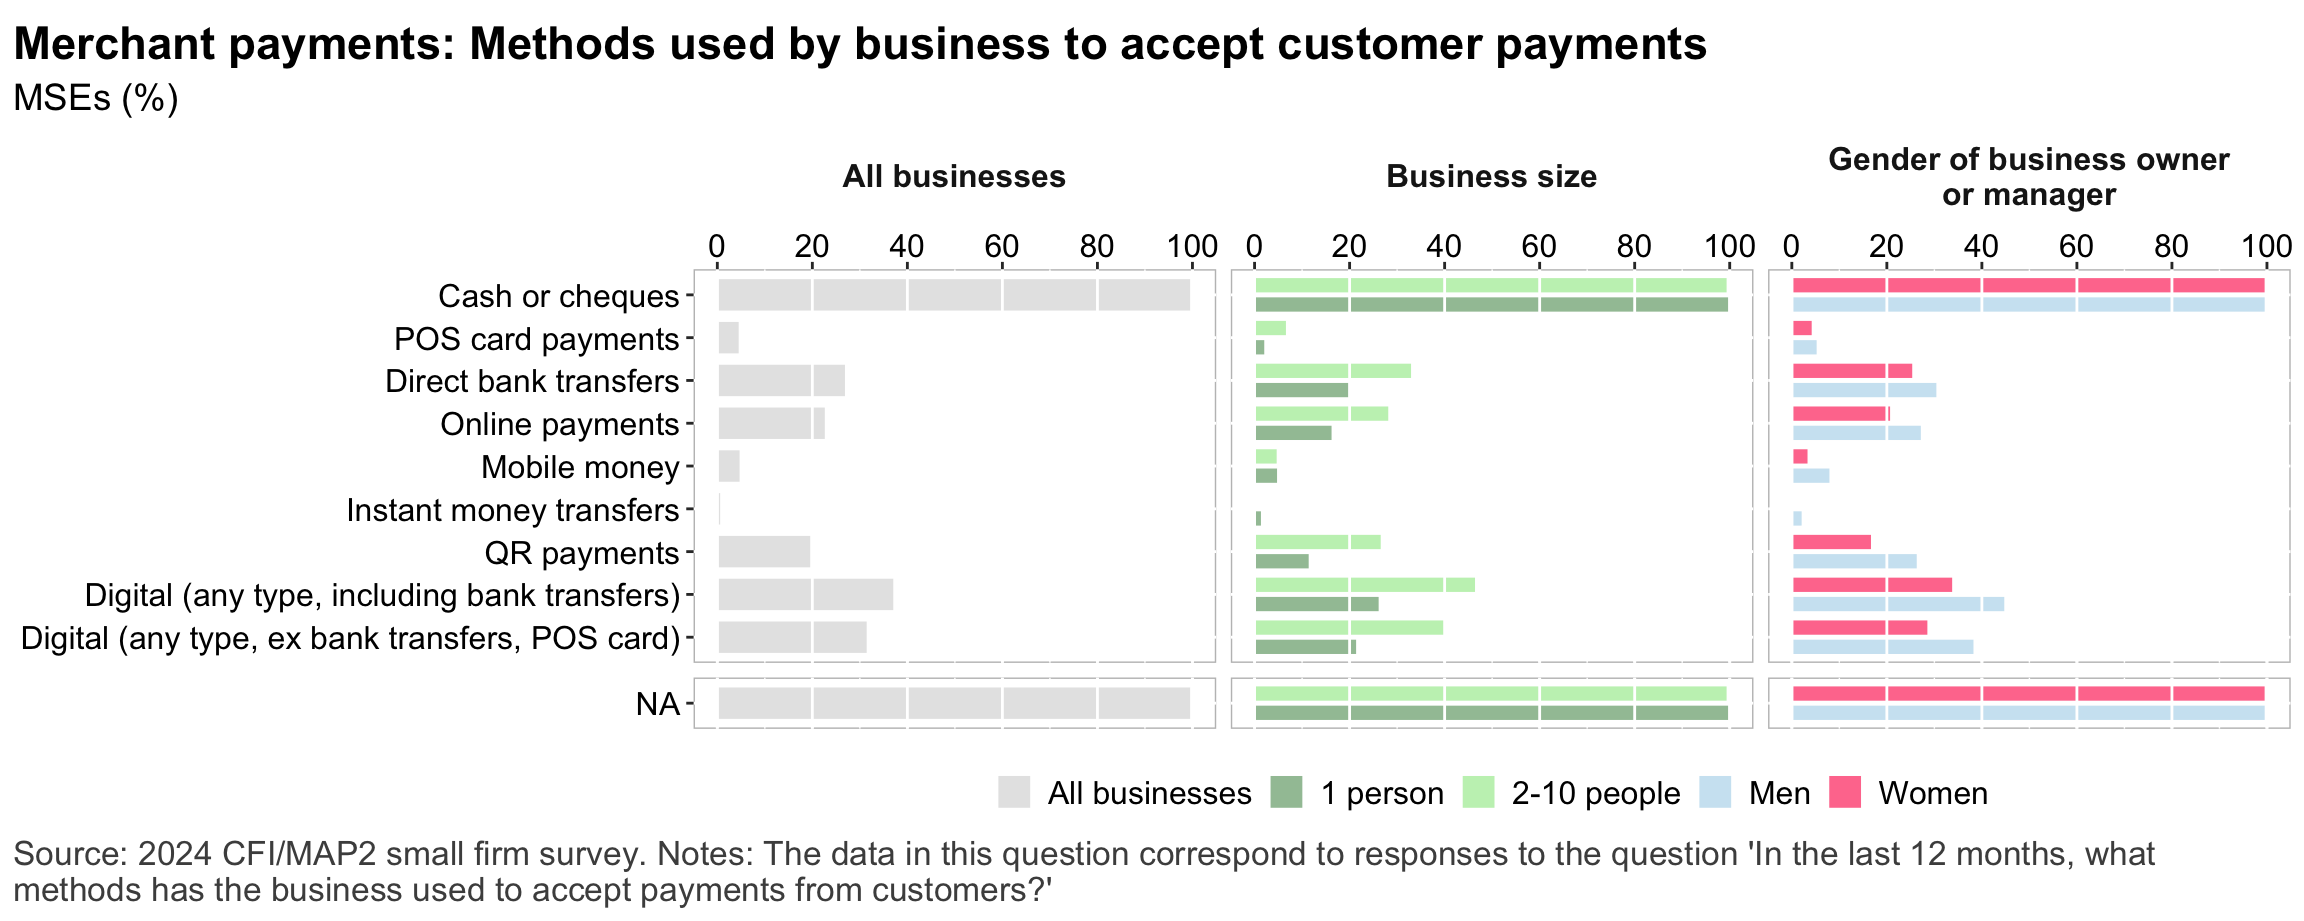
Figure 26: Merchant payments
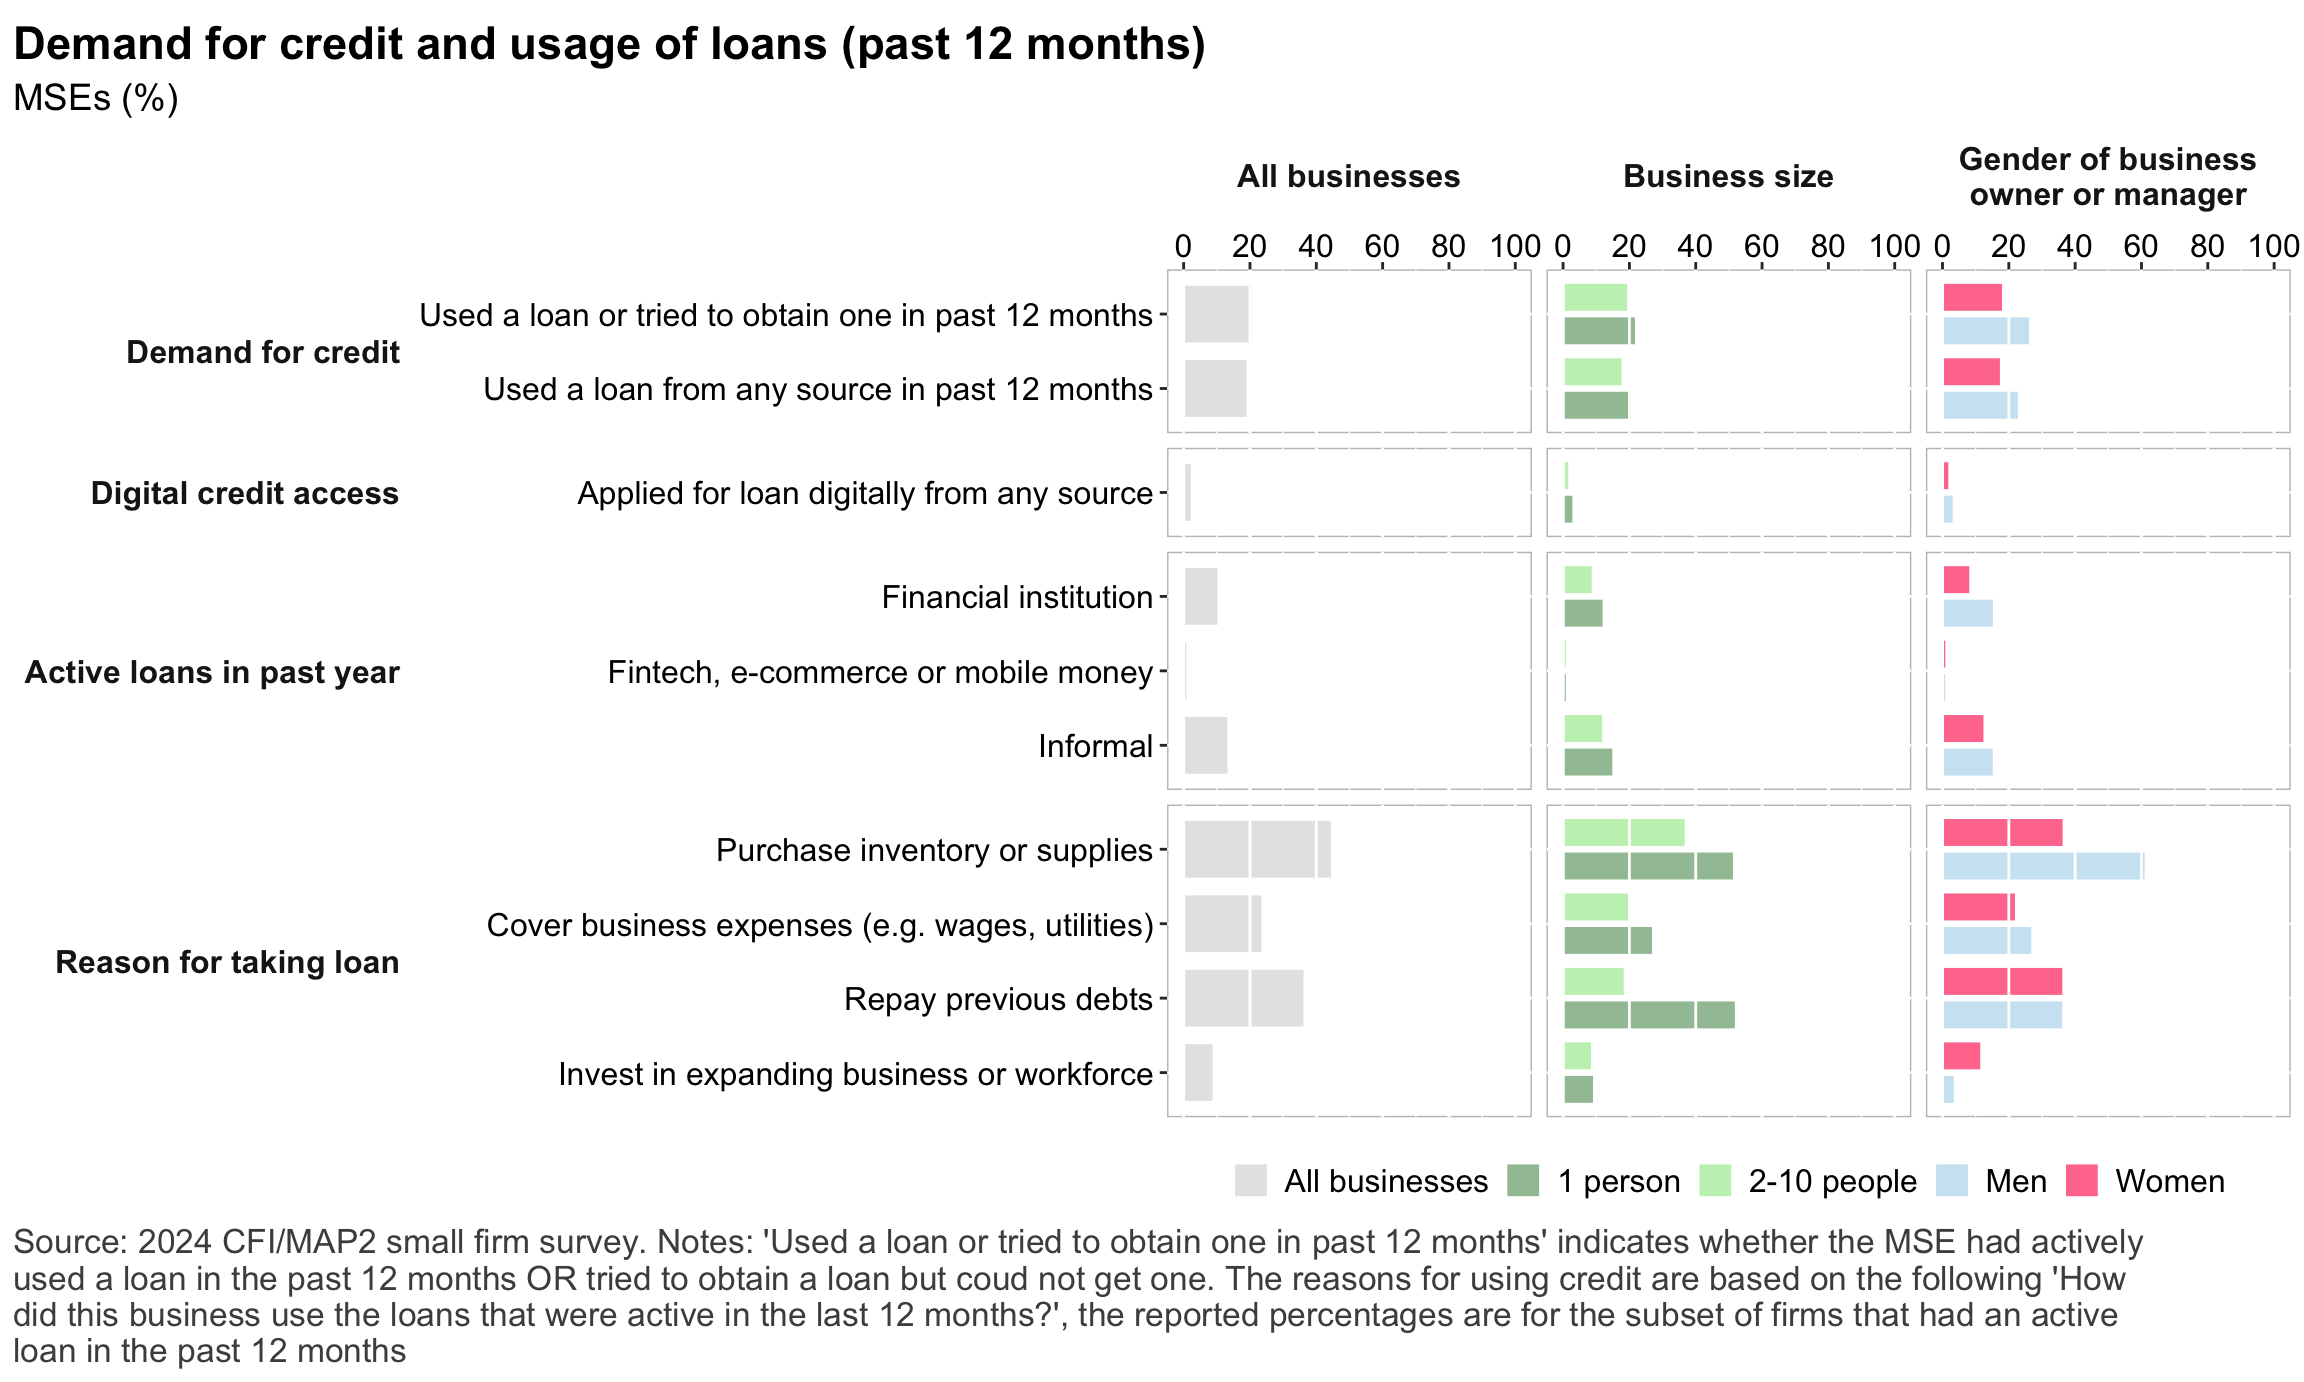
Figure 27: Demand for credit
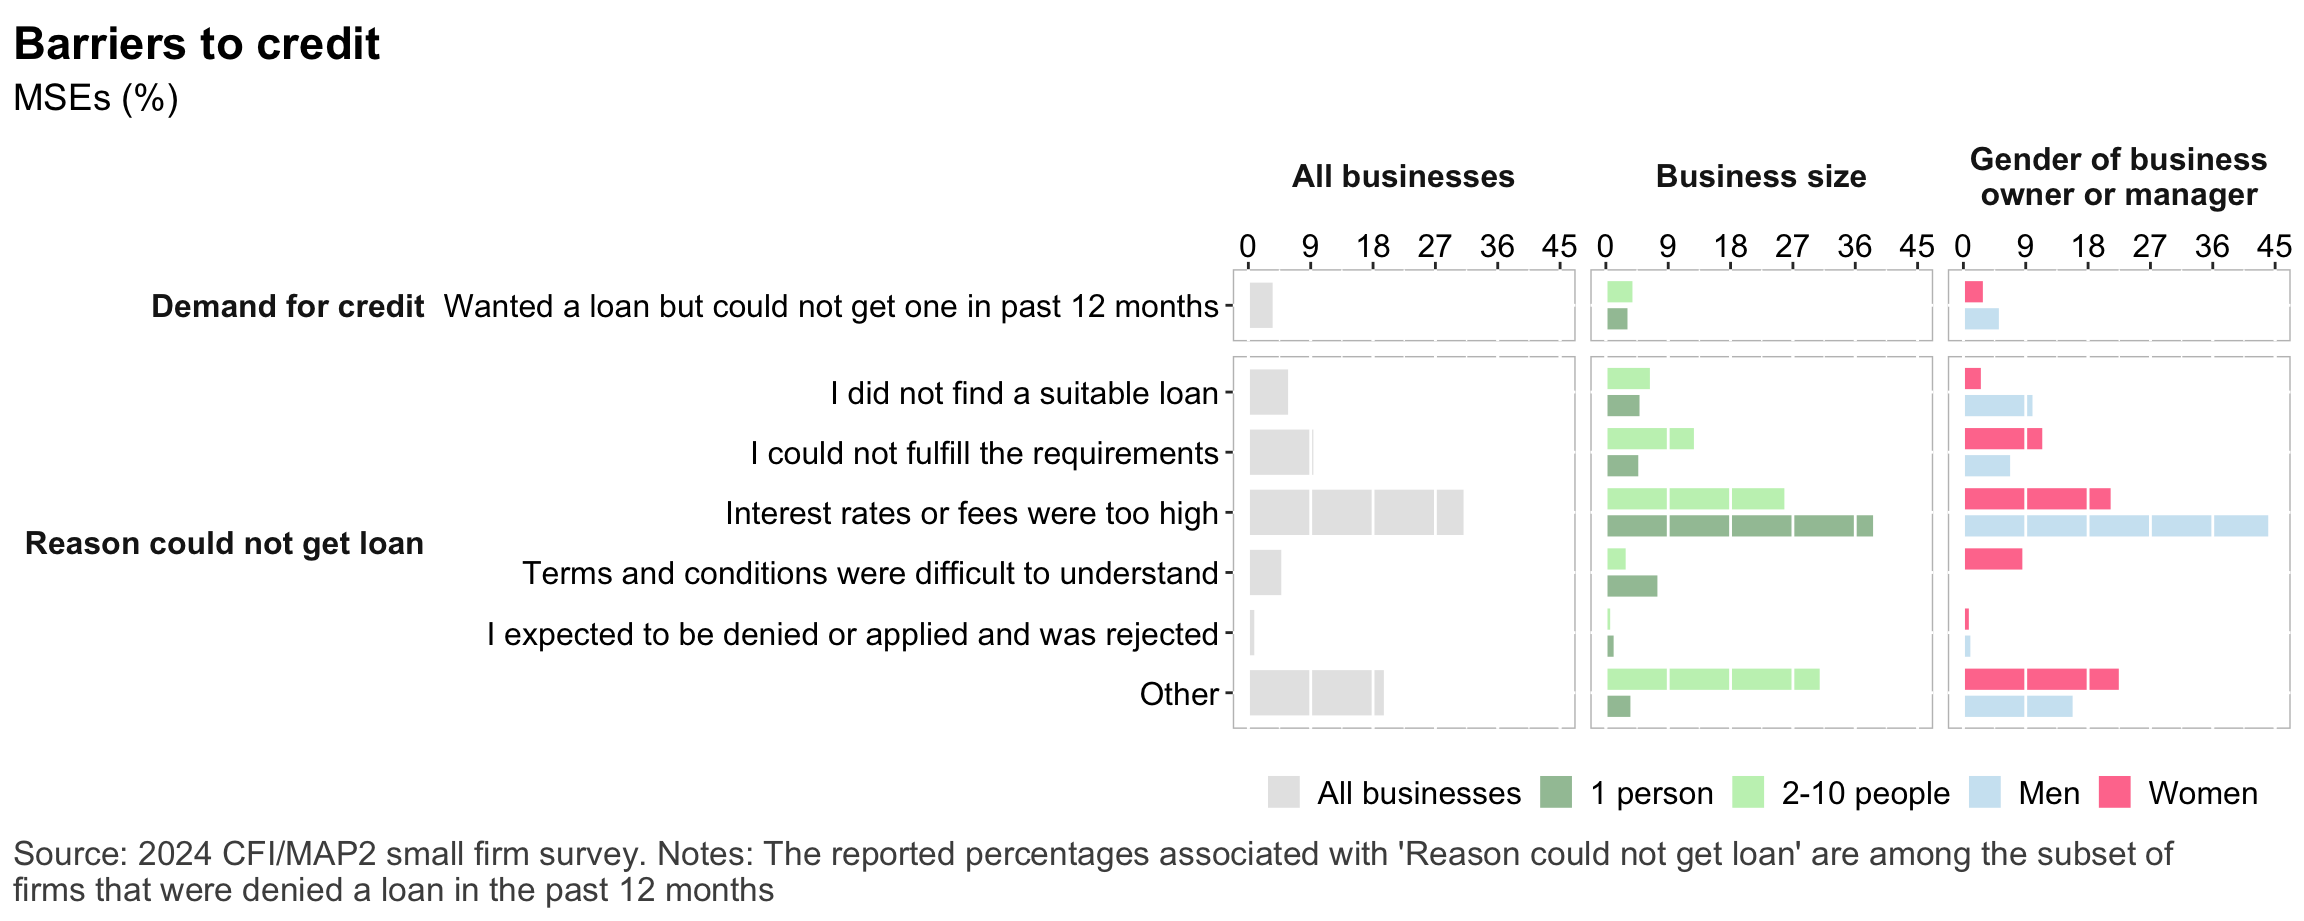
Figure 28: Barriers to credit
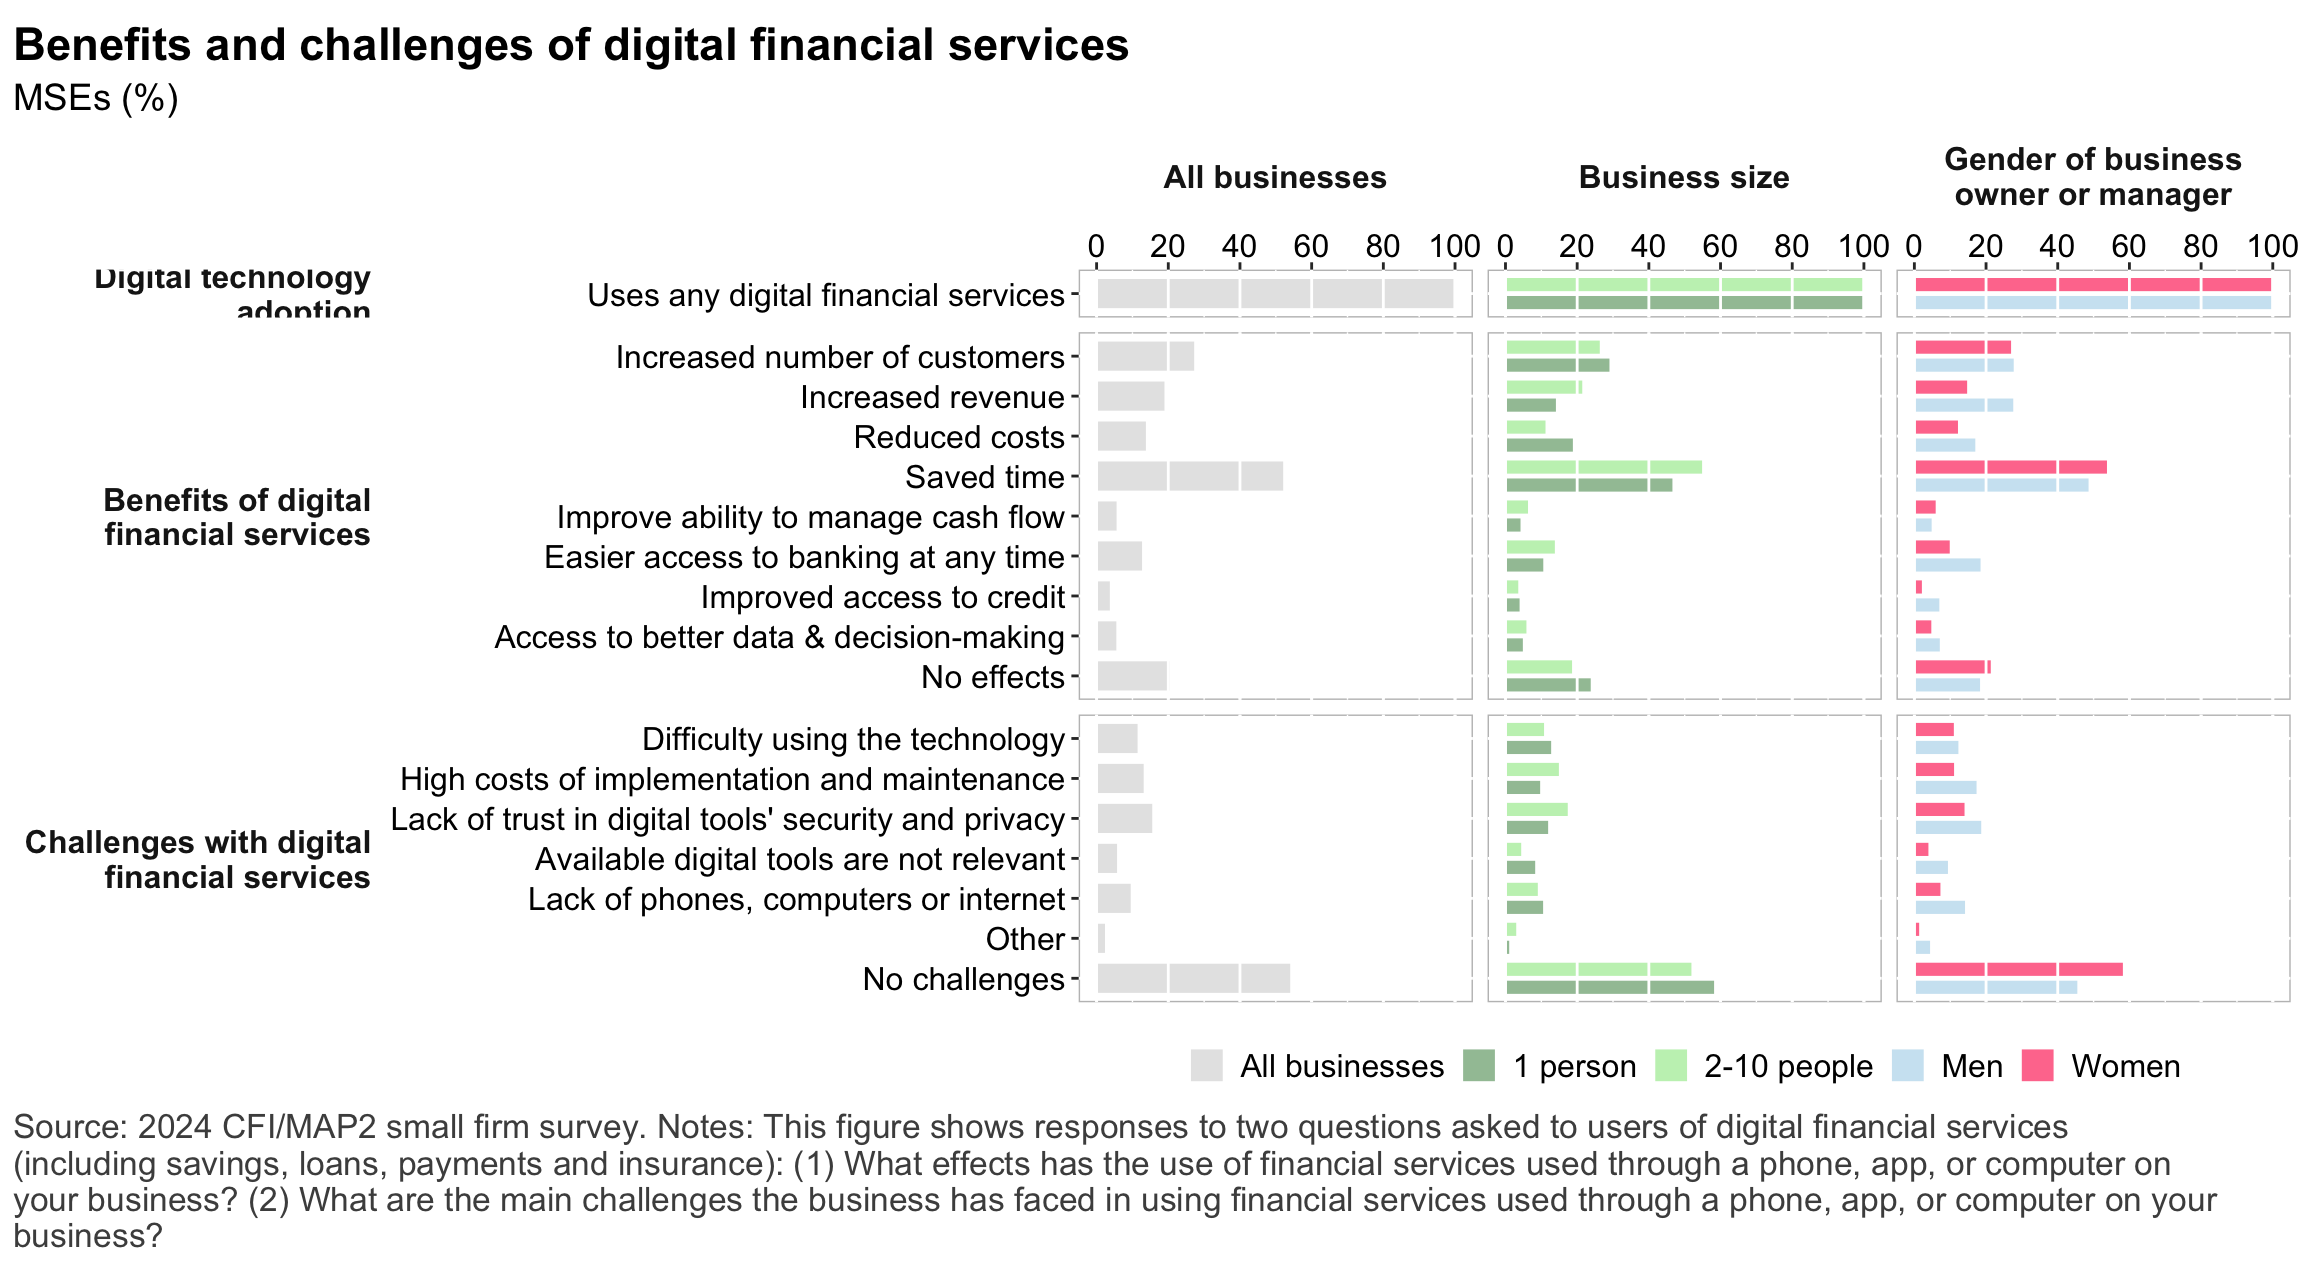
Figure 29: Impacts of digital financial services
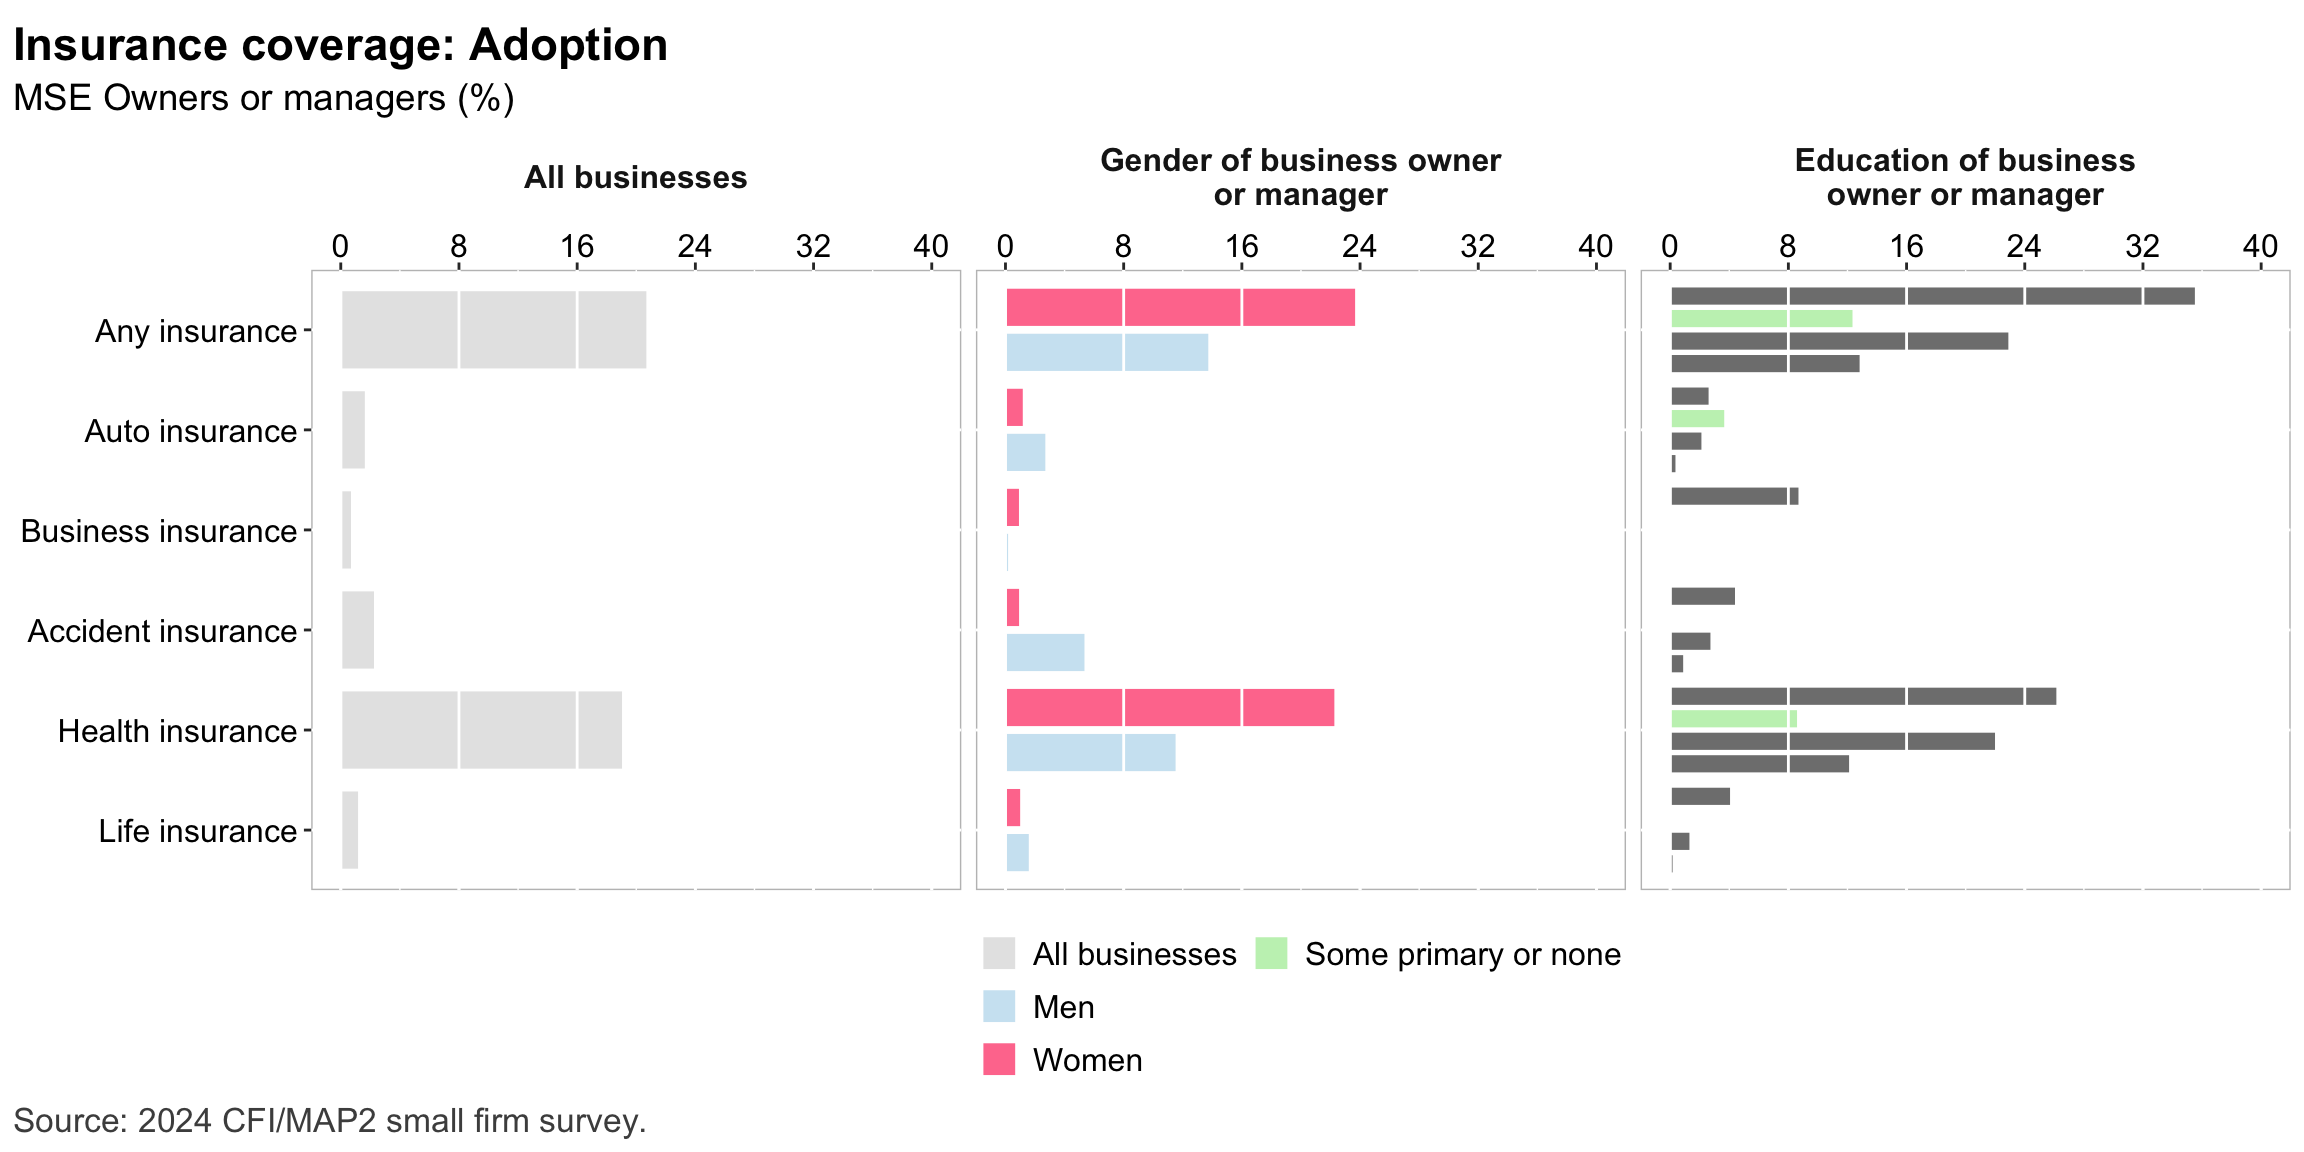
Figure 30: Insurance usage
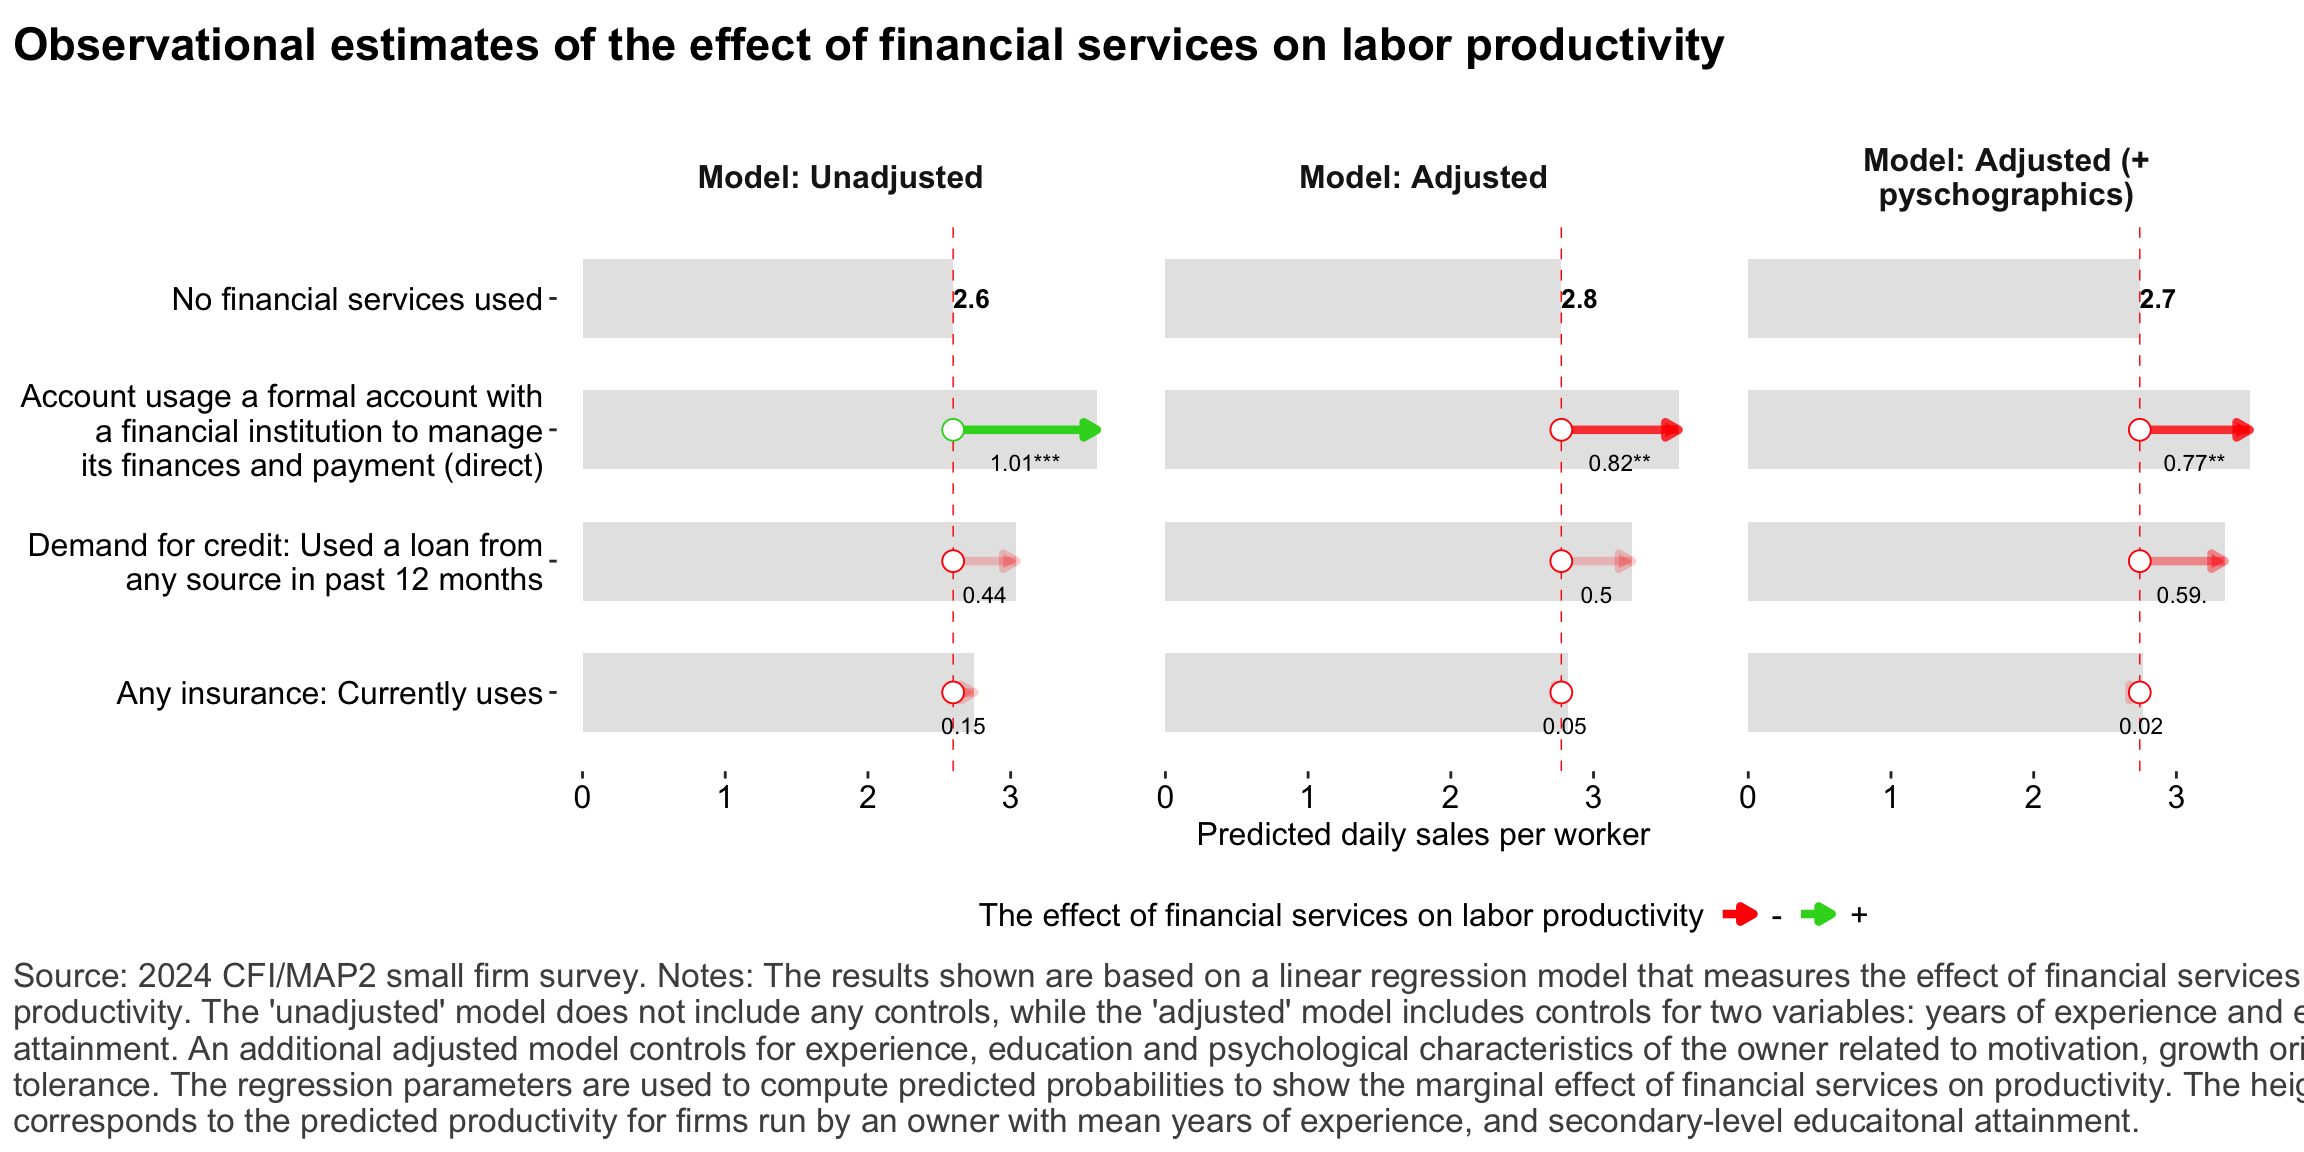
Figure 31: Relationship between financial services and firm-level labor productivity
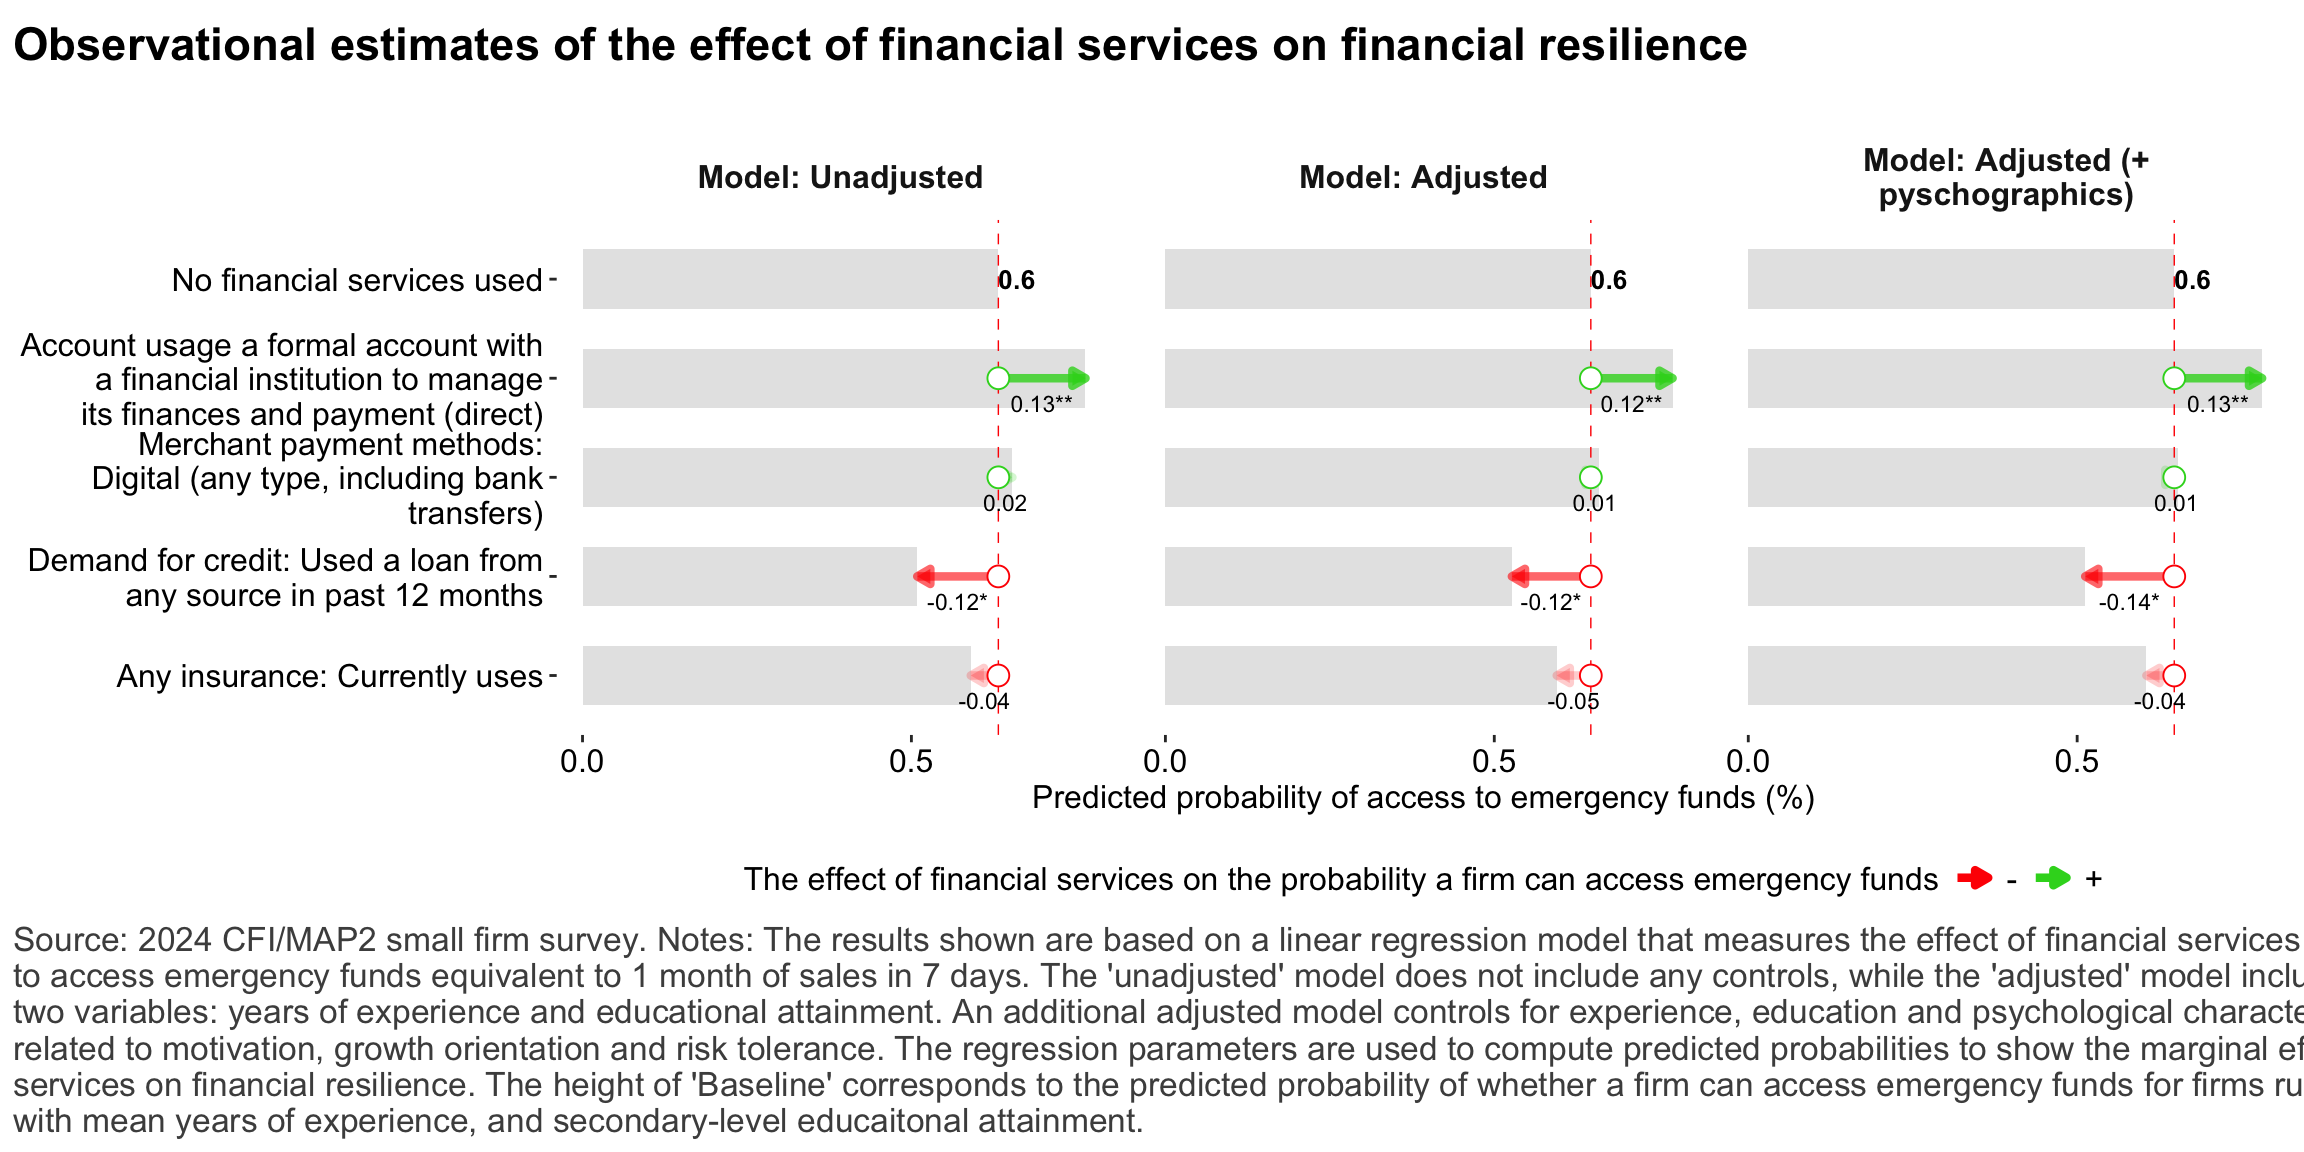
Figure 32: Relationship between financial services and financial resilience
Consumer protection
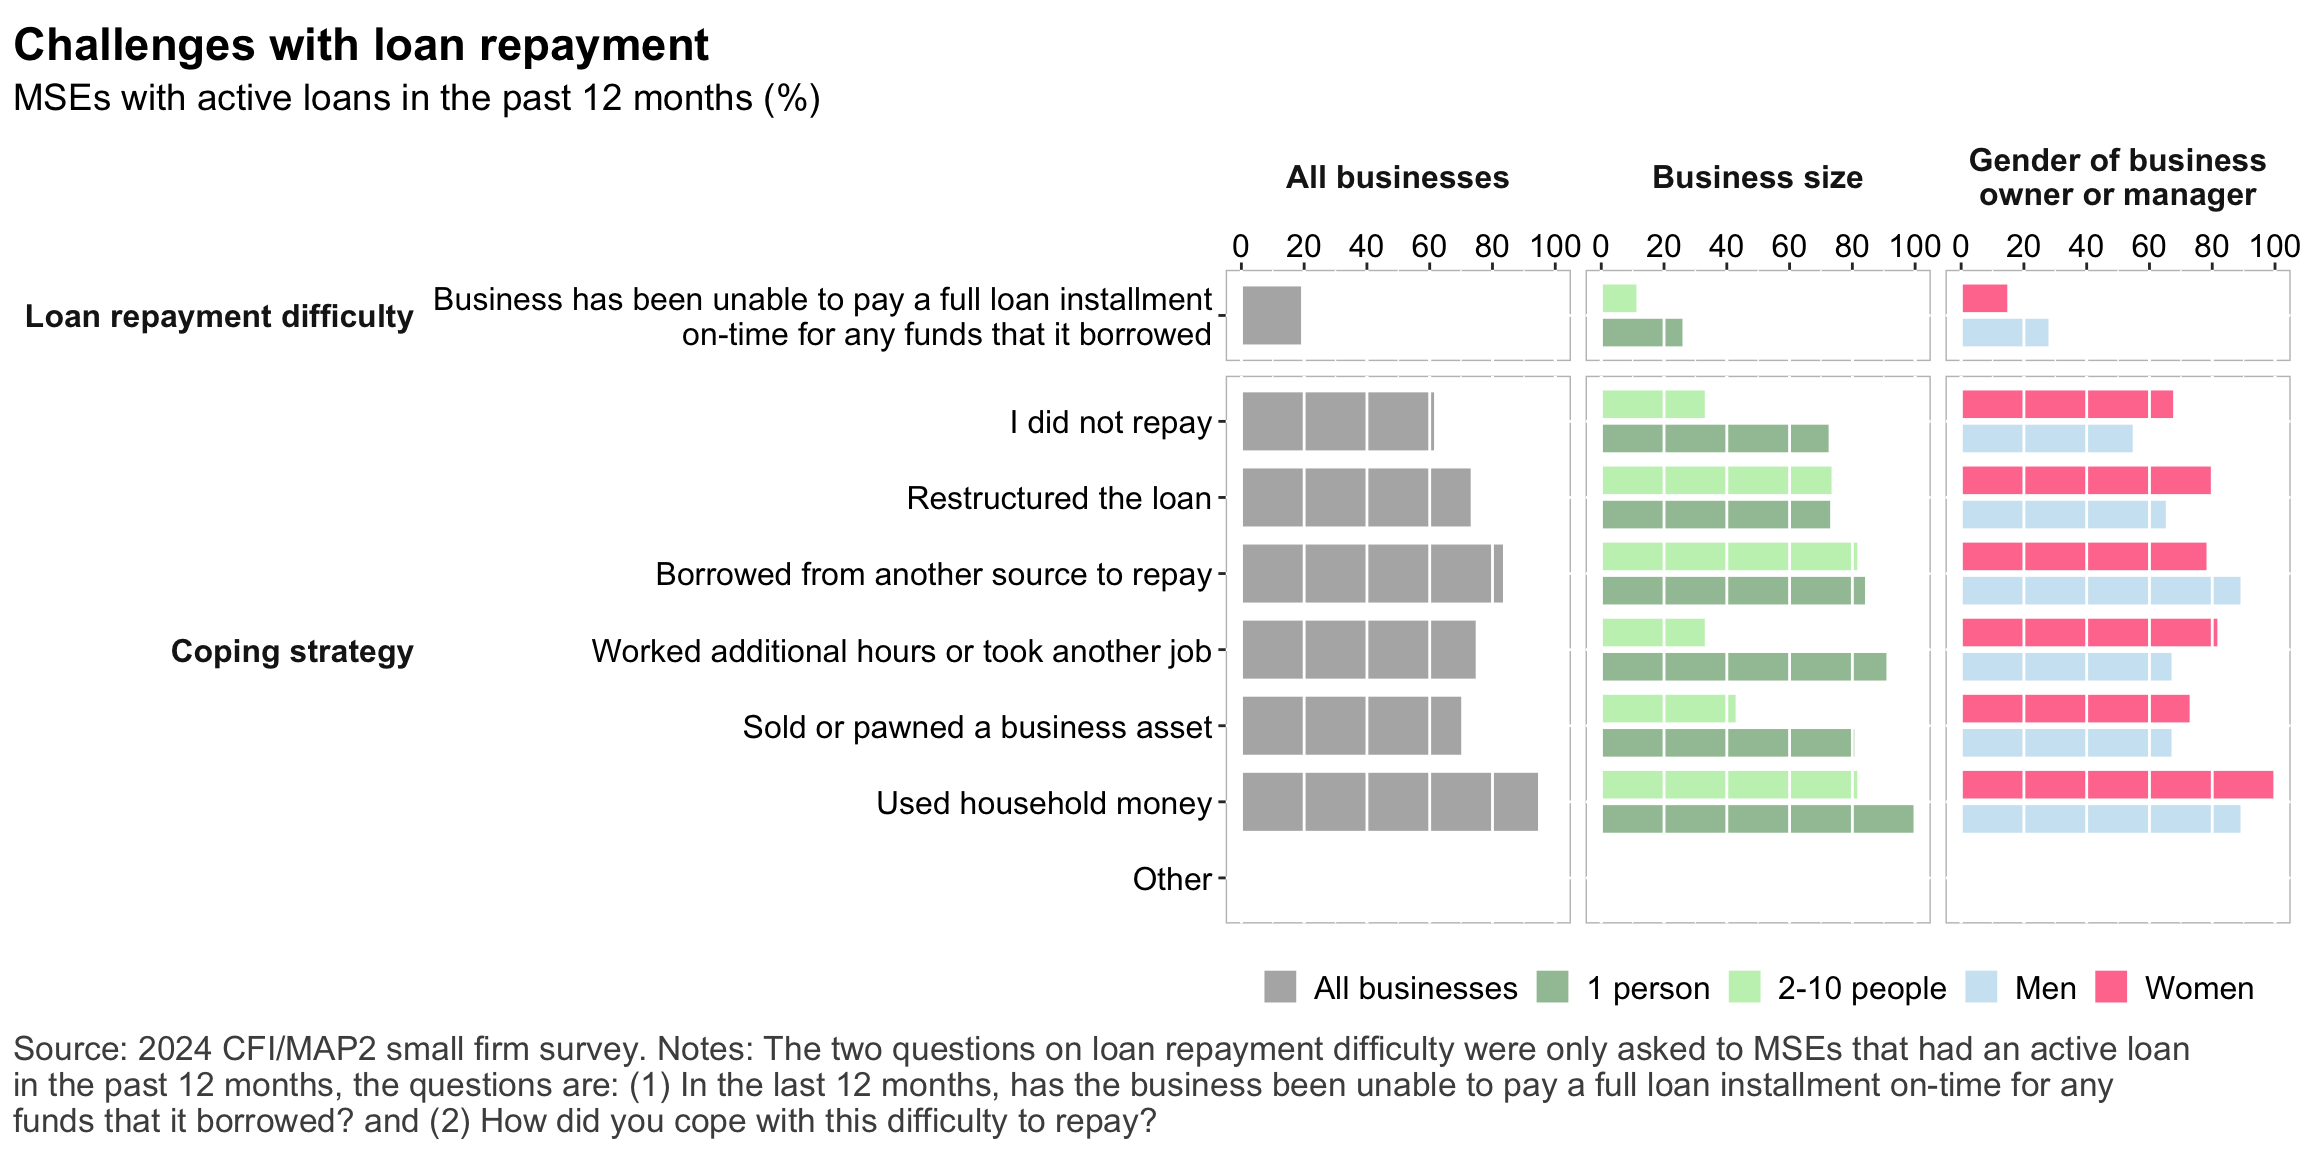
Figure 33: Challenges with loan repayment
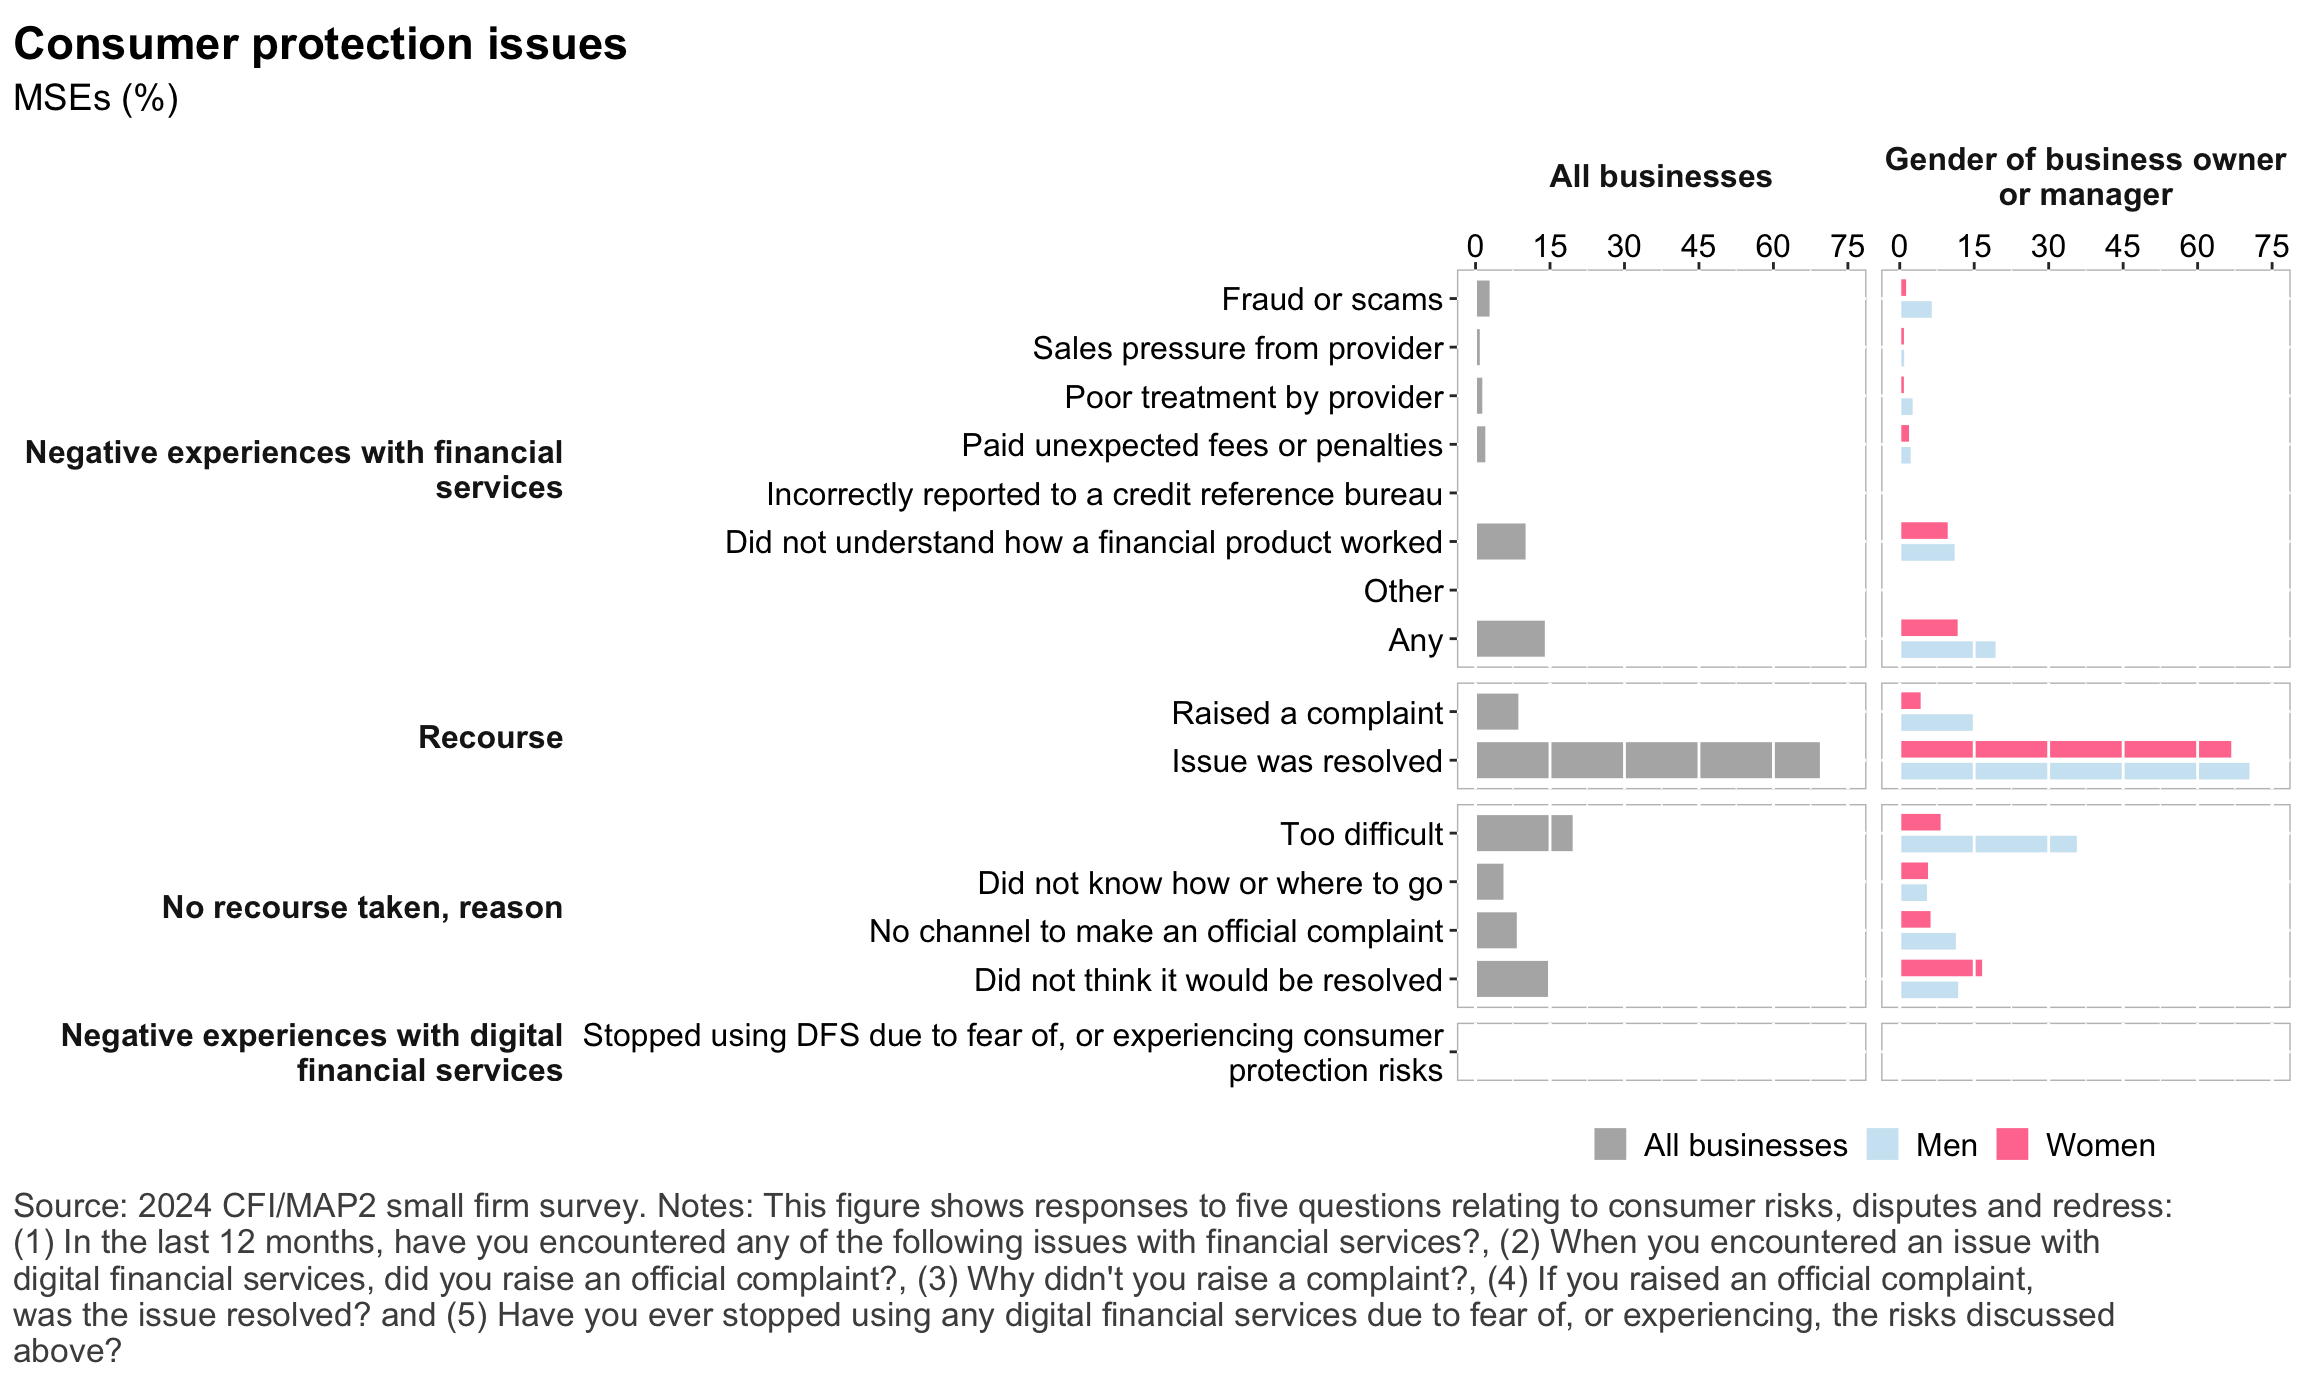
Figure 34: Consumer protection issues
Risks and Resilience
Figure 35: Risks: General
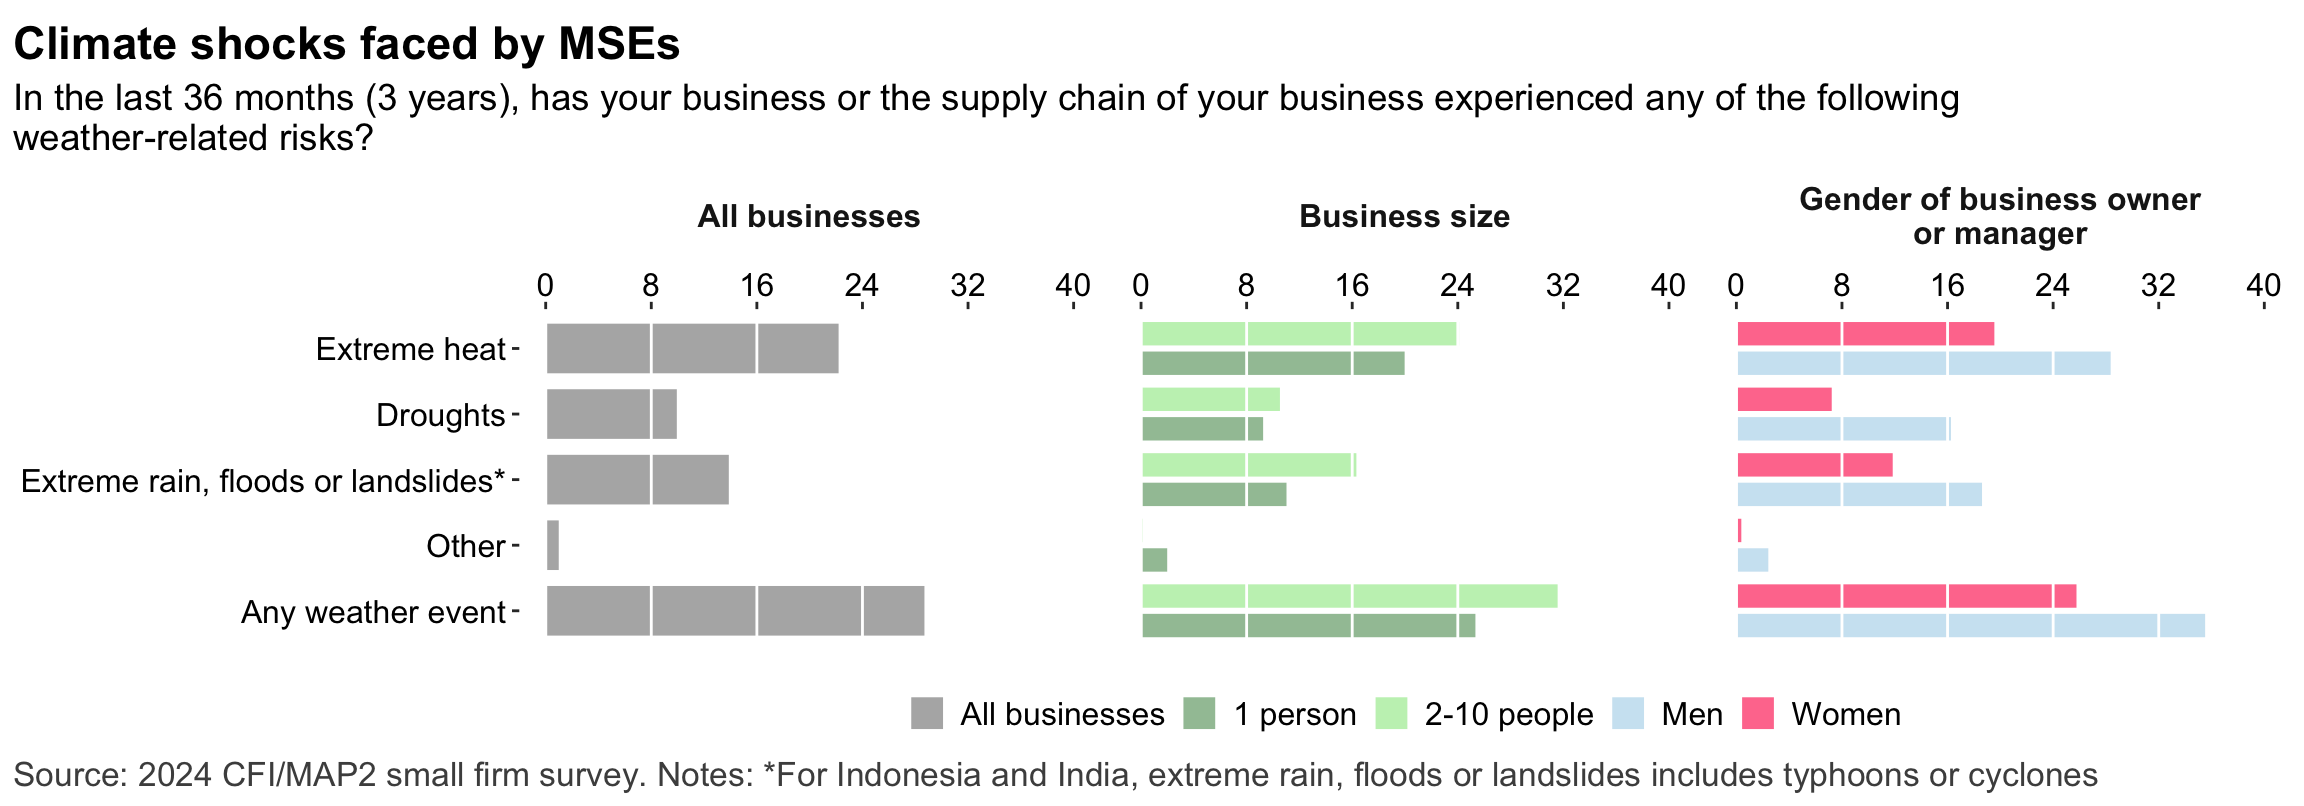
Figure 36: Risks: Climate
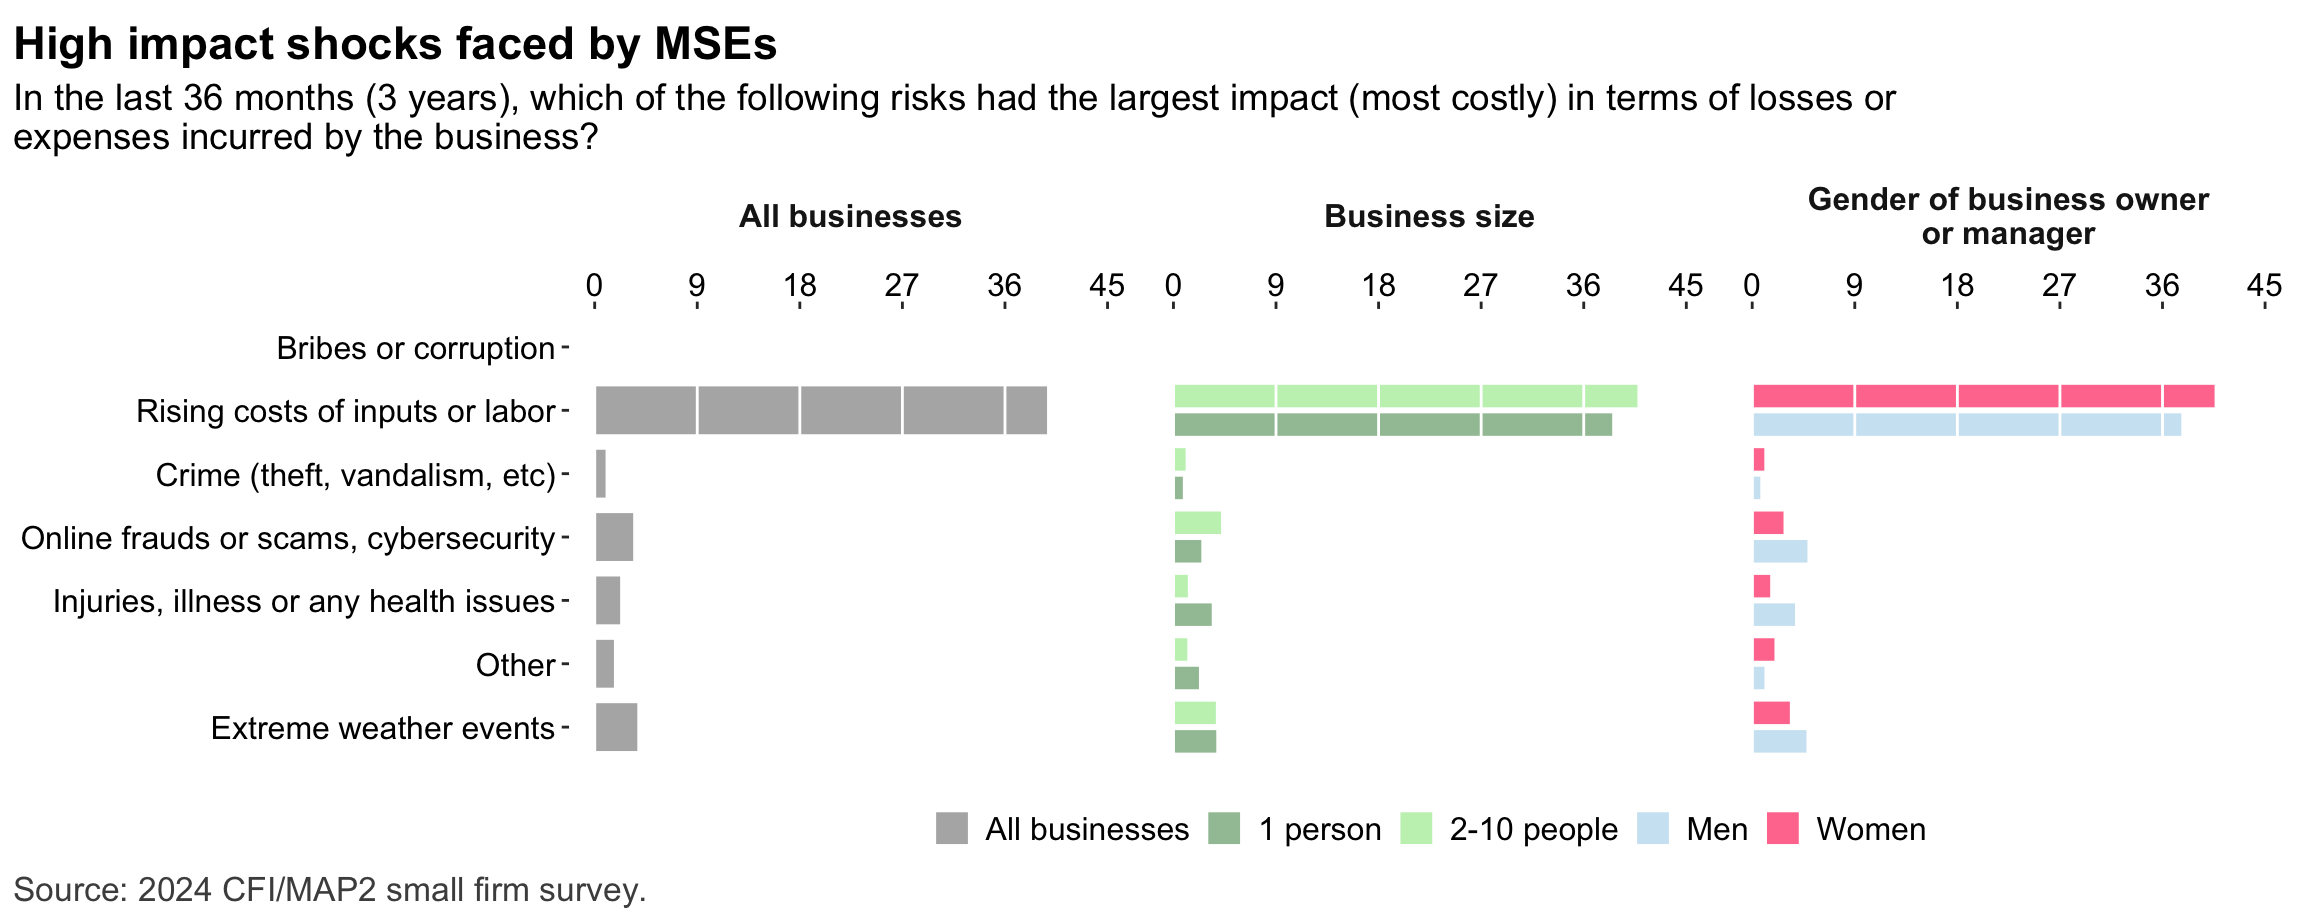
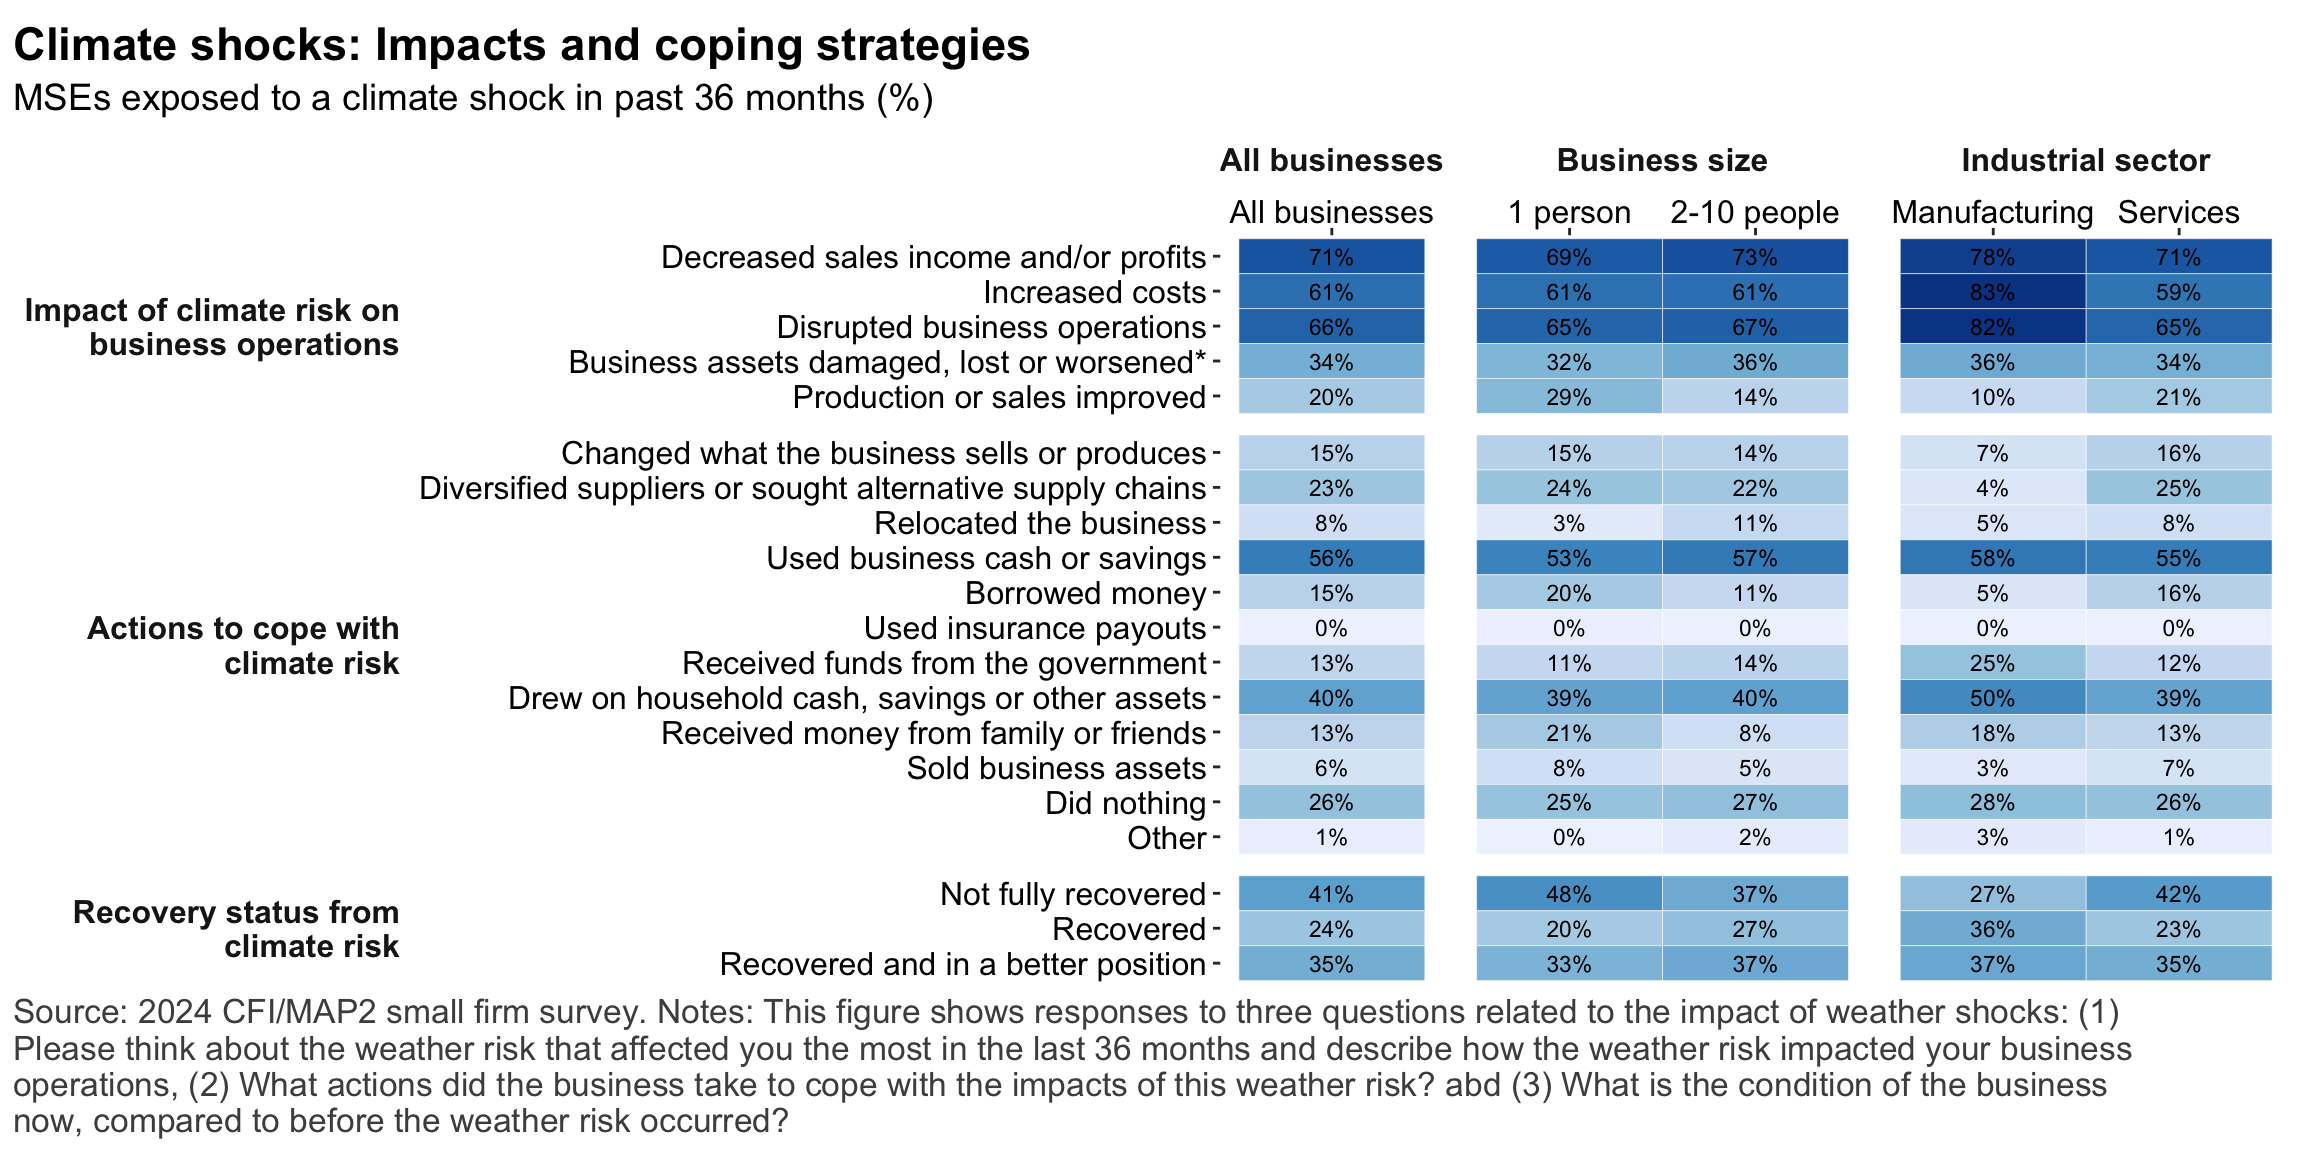
Figure 37: Risks: Impacts
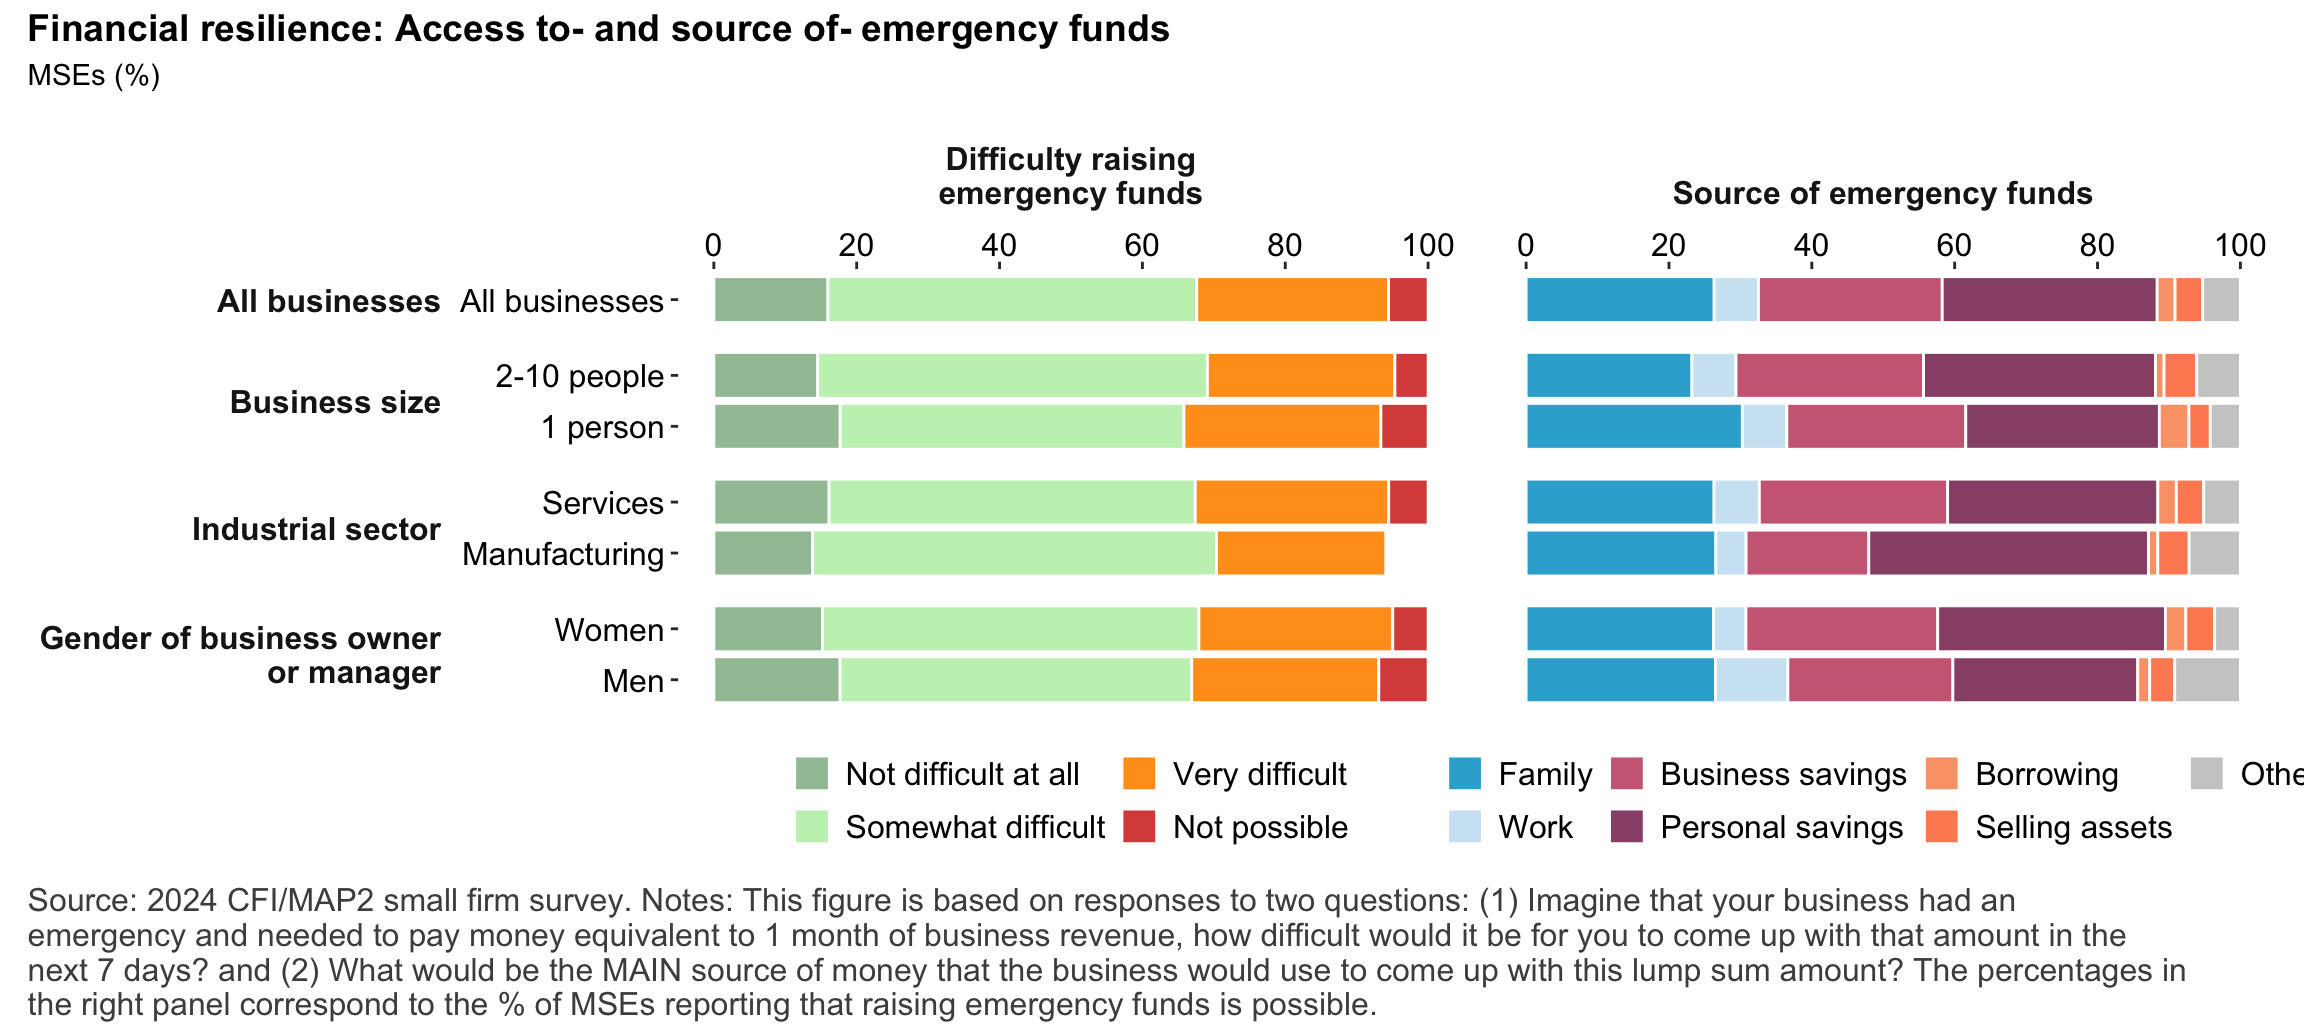
Figure 38: Financial resilience
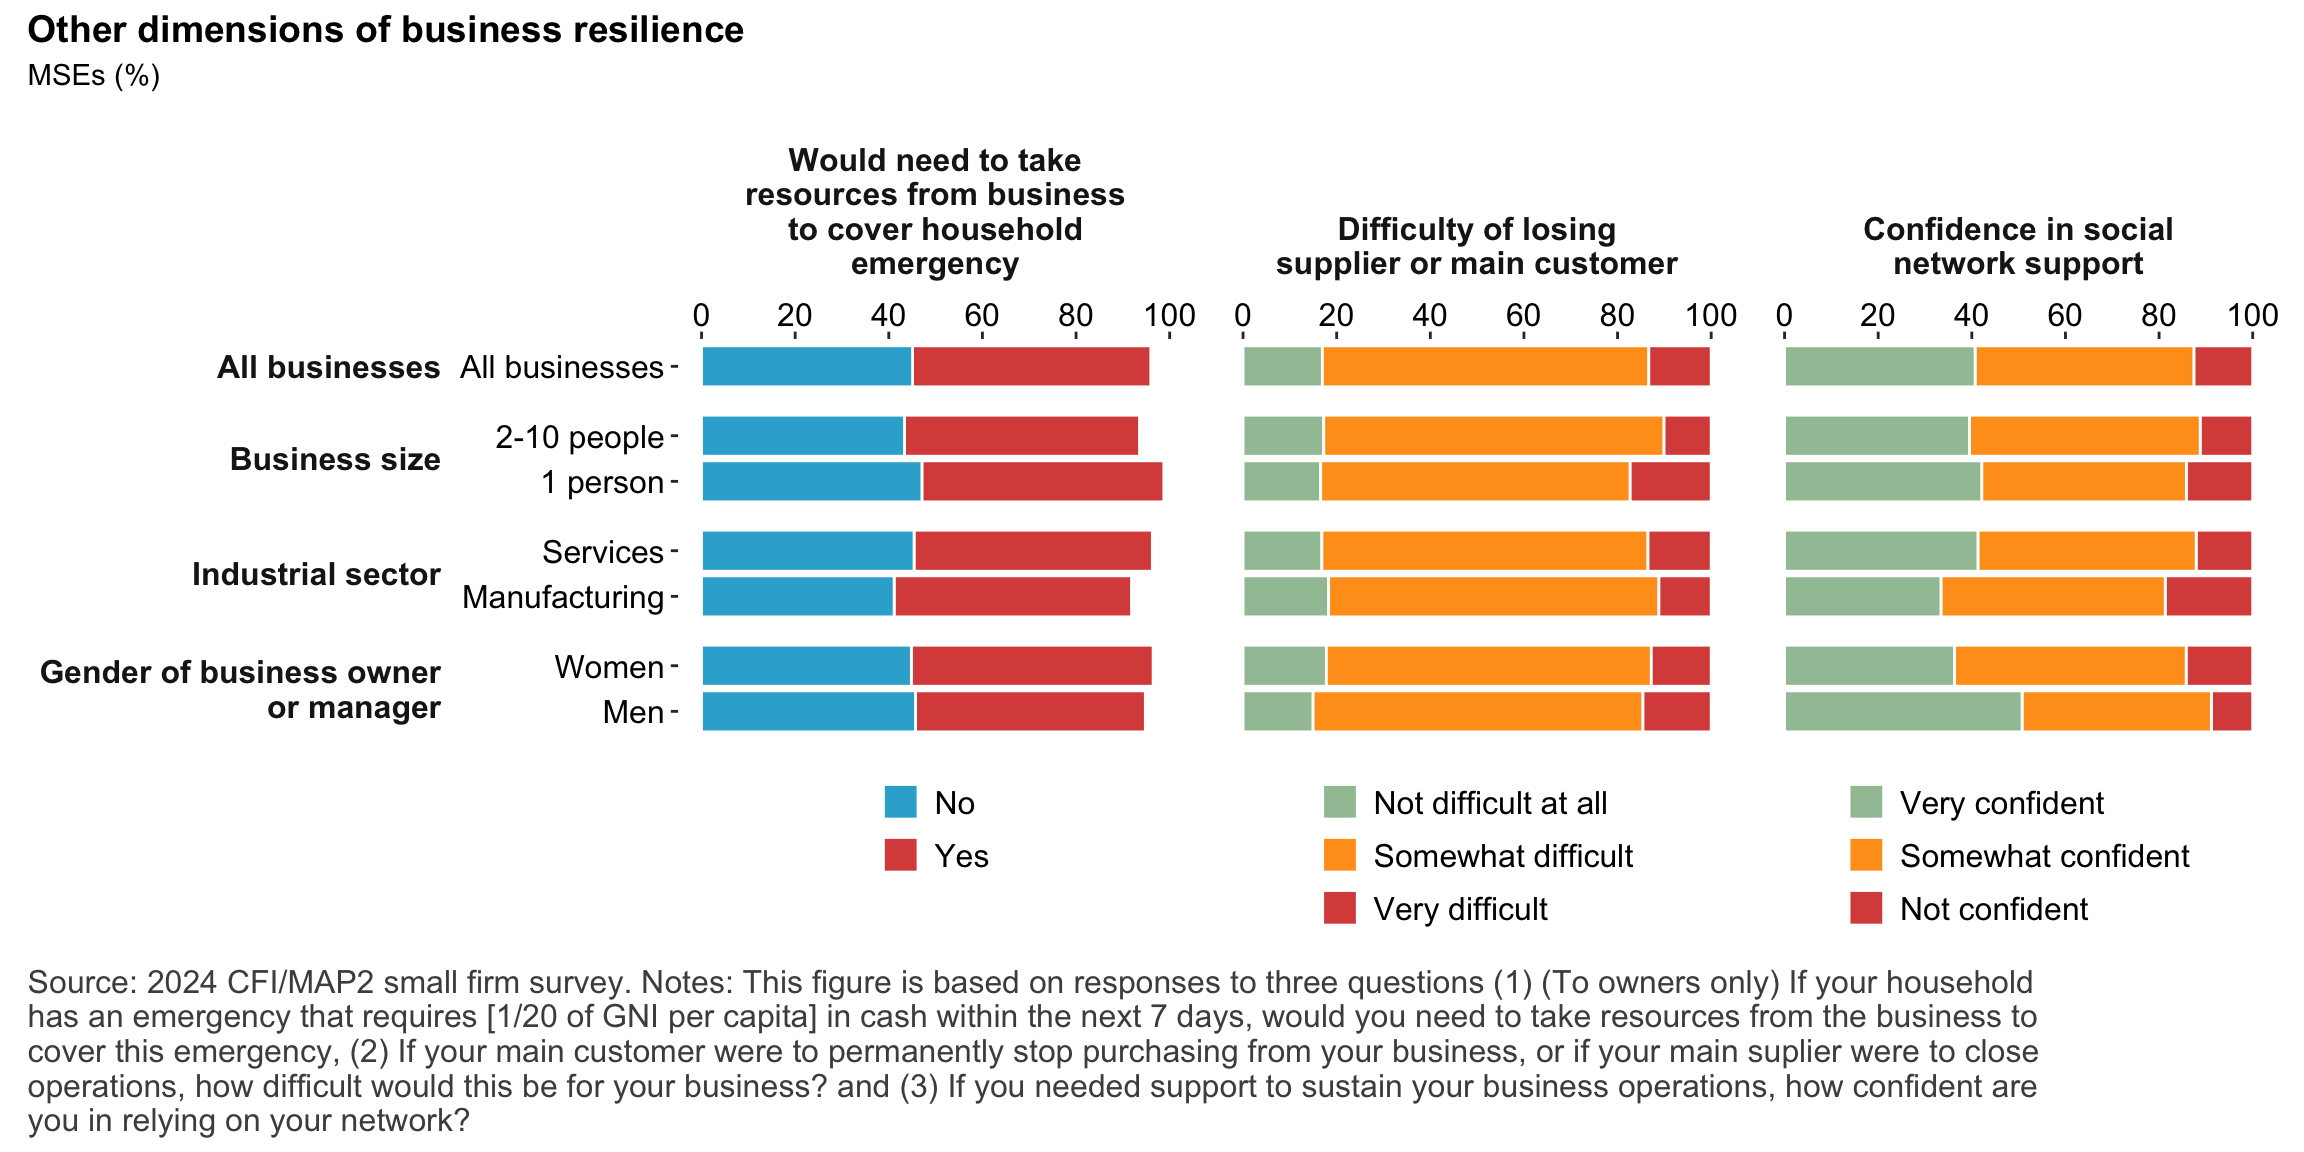
Figure 39: Other dimensions of business resilience
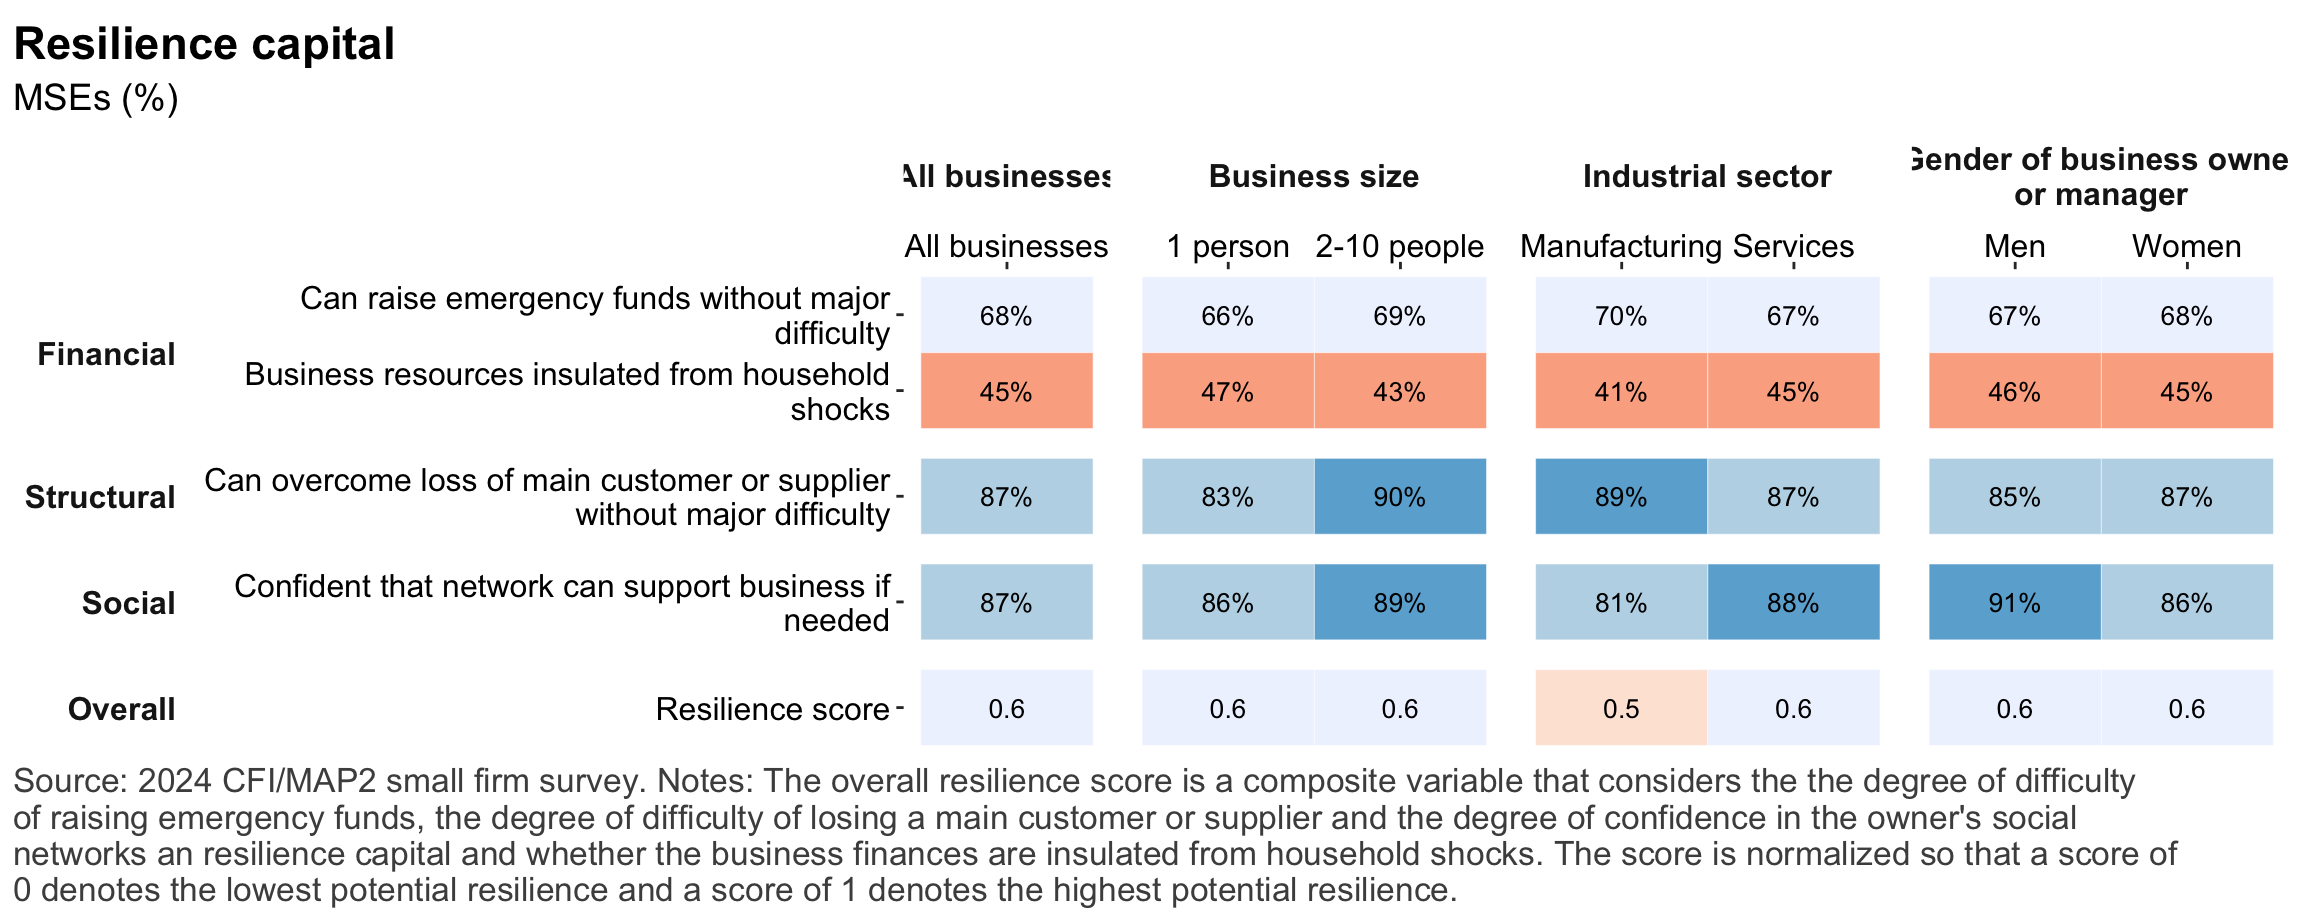
Figure 40: Resilience capital
Figure 1: Geographic distribution of enumerated blocksFigure 2: Estimated business population by size and sectorFigure 3: MSE sample characteristicsFigure 4: MSEs by sector of productionFigure 5: MSE revenues and productivityFigure 6: Changes in MSE outcomes in past yearFigure 7: Gender composition of MSEs by sise and sectorFigure 8: MSE owner characteristicsFigure 9: Pyschographic characrteristics of SME owners or managers, by genderFigure 10: Correlation between owner’s motivations, goals and attitudes to riskFigure 11: Correlation between owner’s motivations, goals and attitudes to riskFigure 12: Relationship between owner’s gender and motivations, goals and attitudes to riskFigure 13: MSEs and codependence with owner’s householdFigure 14: Access to connectivity and devicesFigure 15: Predictors of digital technology adoptionFigure 16: Digital technology adoption by use caseFigure 17: Depth of digital technology adoptionFigure 18: Digital technology adoption factorsFigure 19: Relationship between internet-connectivity and firm-level labor productivityFigure 20: Relationship between digital technology and firm-level labor productivityFigure 21: Relationship between digital technology adoption and firm-level labor productivityFigure 22: Relationship between breadth of digital technology adoption and firm-level labor productivityFigure 23: Relationship between digital technology and financial resilienceFigure 24: Relationship between digital technology adoption and financial resilienceFigure 25: Financical accounts and savingsFigure 26: Merchant paymentsFigure 27: Demand for creditFigure 28: Barriers to creditFigure 29: Impacts of digital financial servicesFigure 30: Insurance usageFigure 31: Relationship between financial services and firm-level labor productivityFigure 32: Relationship between financial services and financial resilienceFigure 33: Challenges with loan repaymentFigure 34: Consumer protection issuesFigure 35: Risks: GeneralFigure 36: Risks: ClimateFigure 37: Risks: ImpactsFigure 38: Financial resilienceFigure 39: Other dimensions of business resilienceFigure 40: Resilience capital