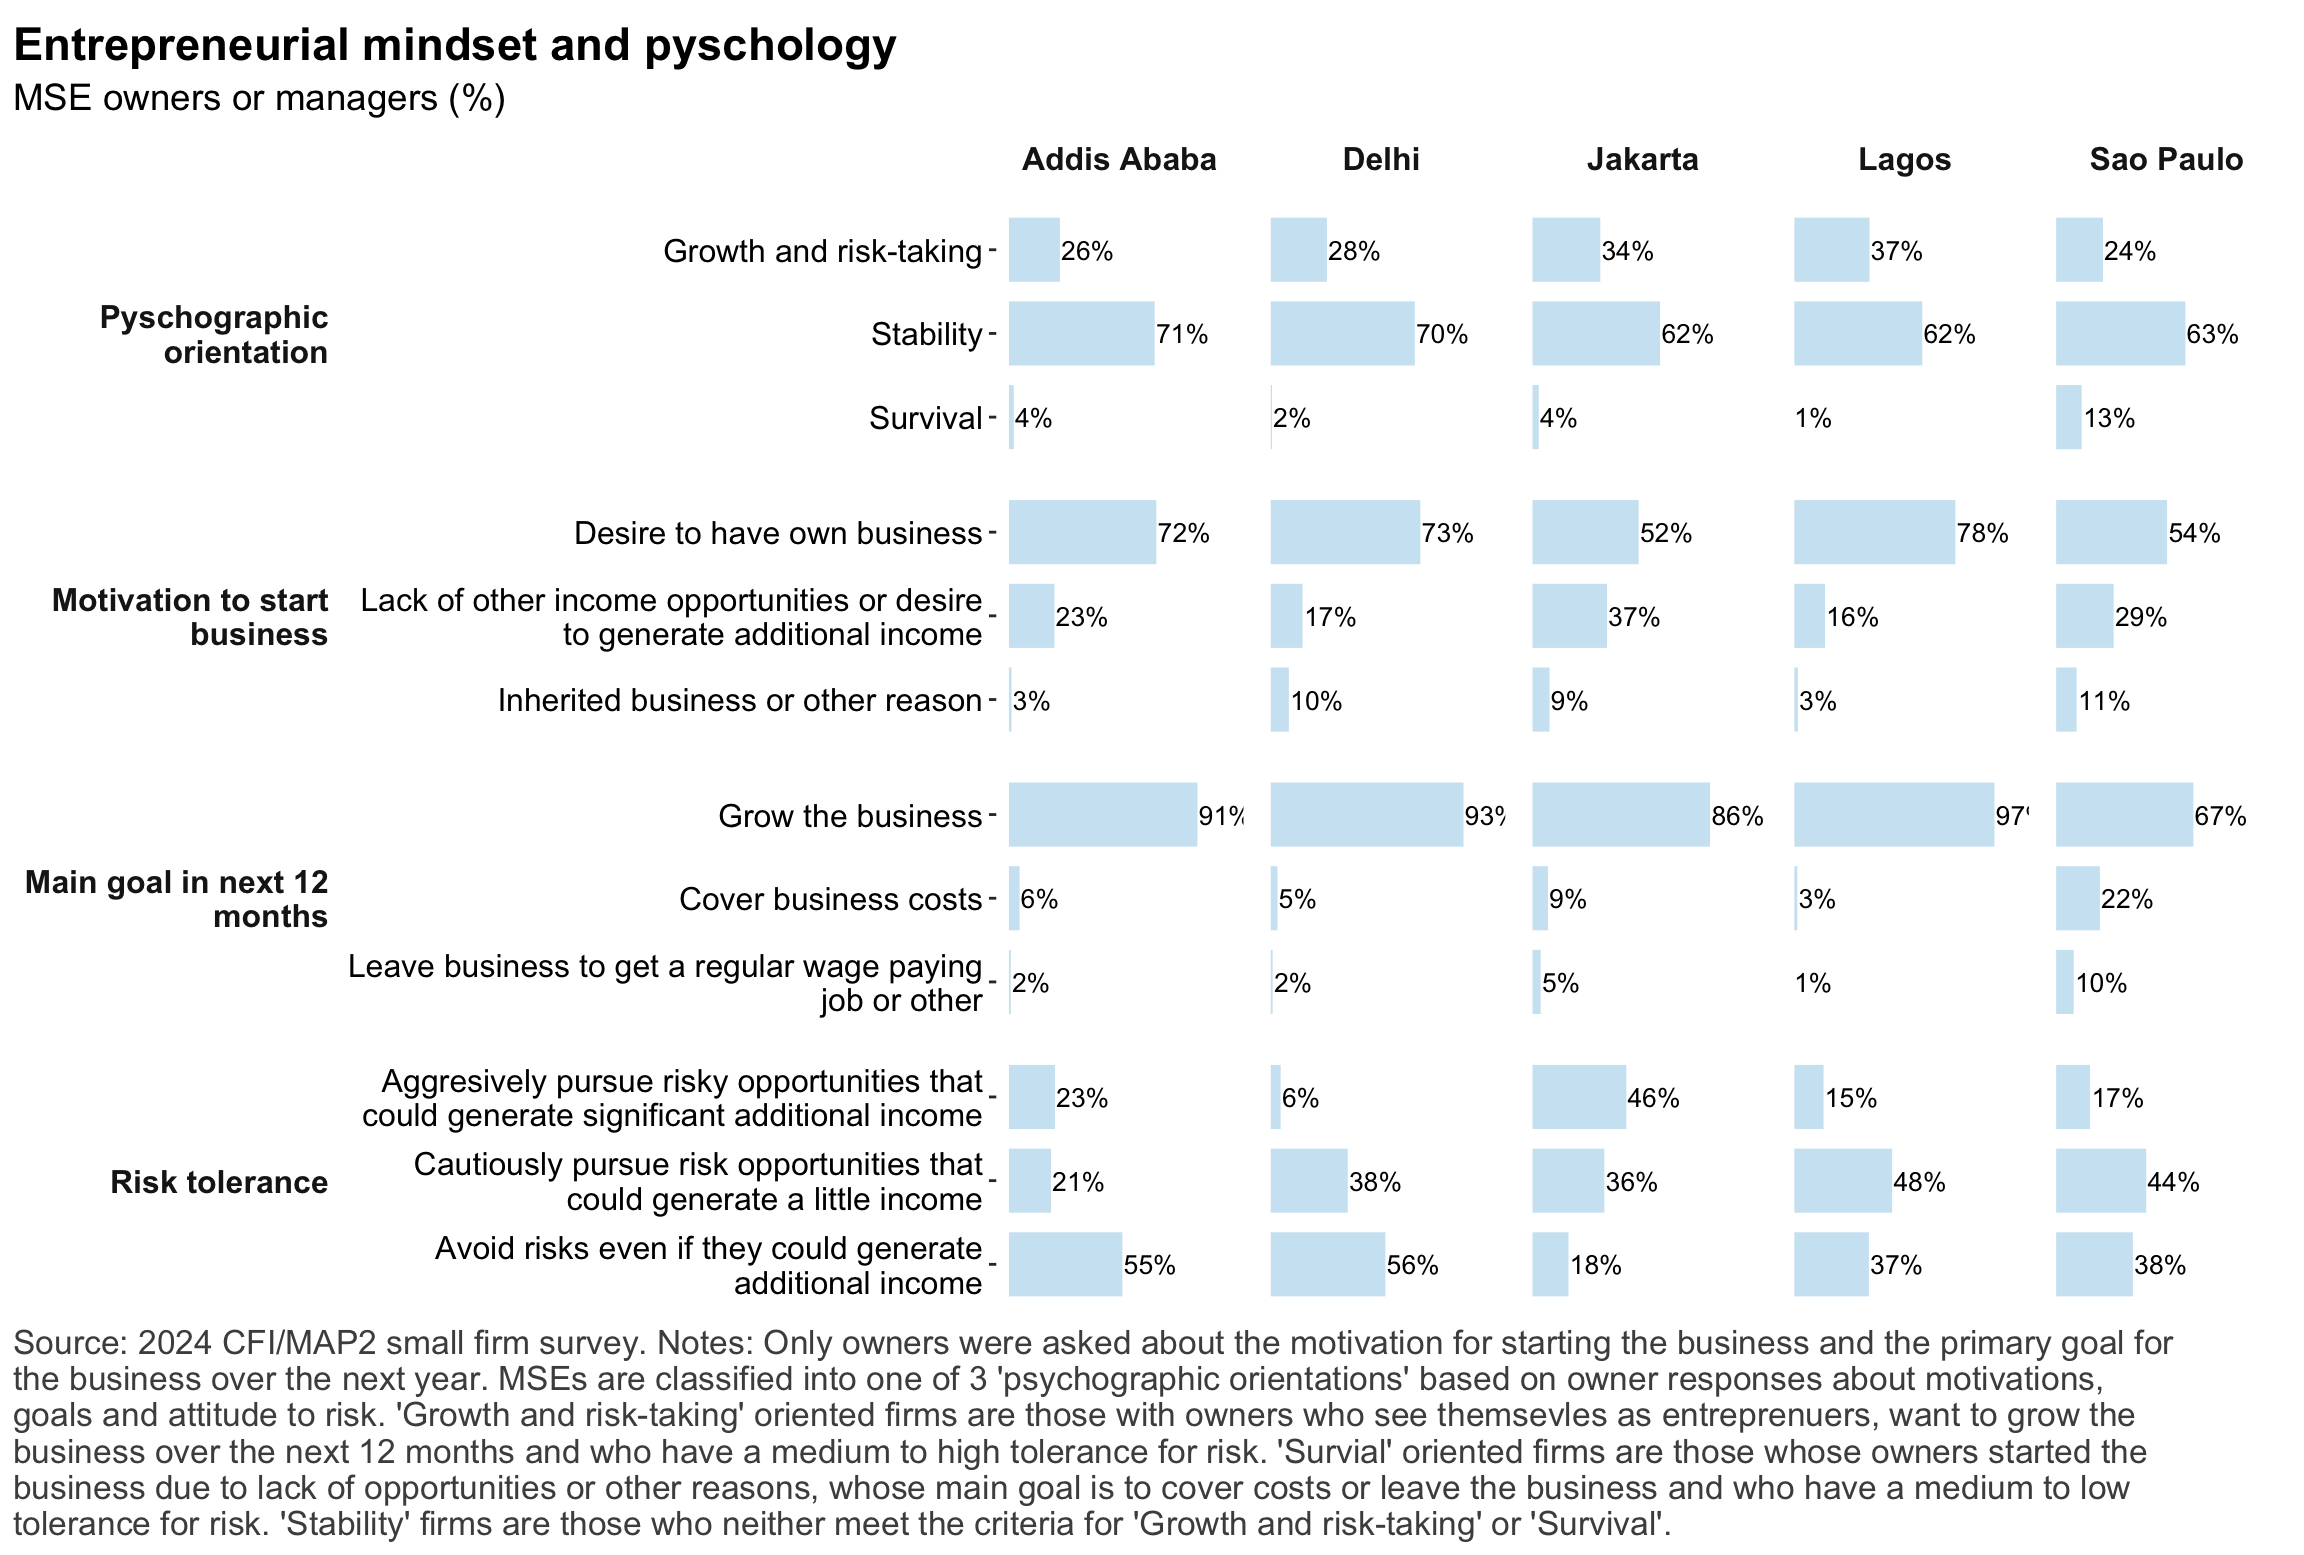
Figure 9: Pyschographic characrteristics of SME owners or managers, by gender
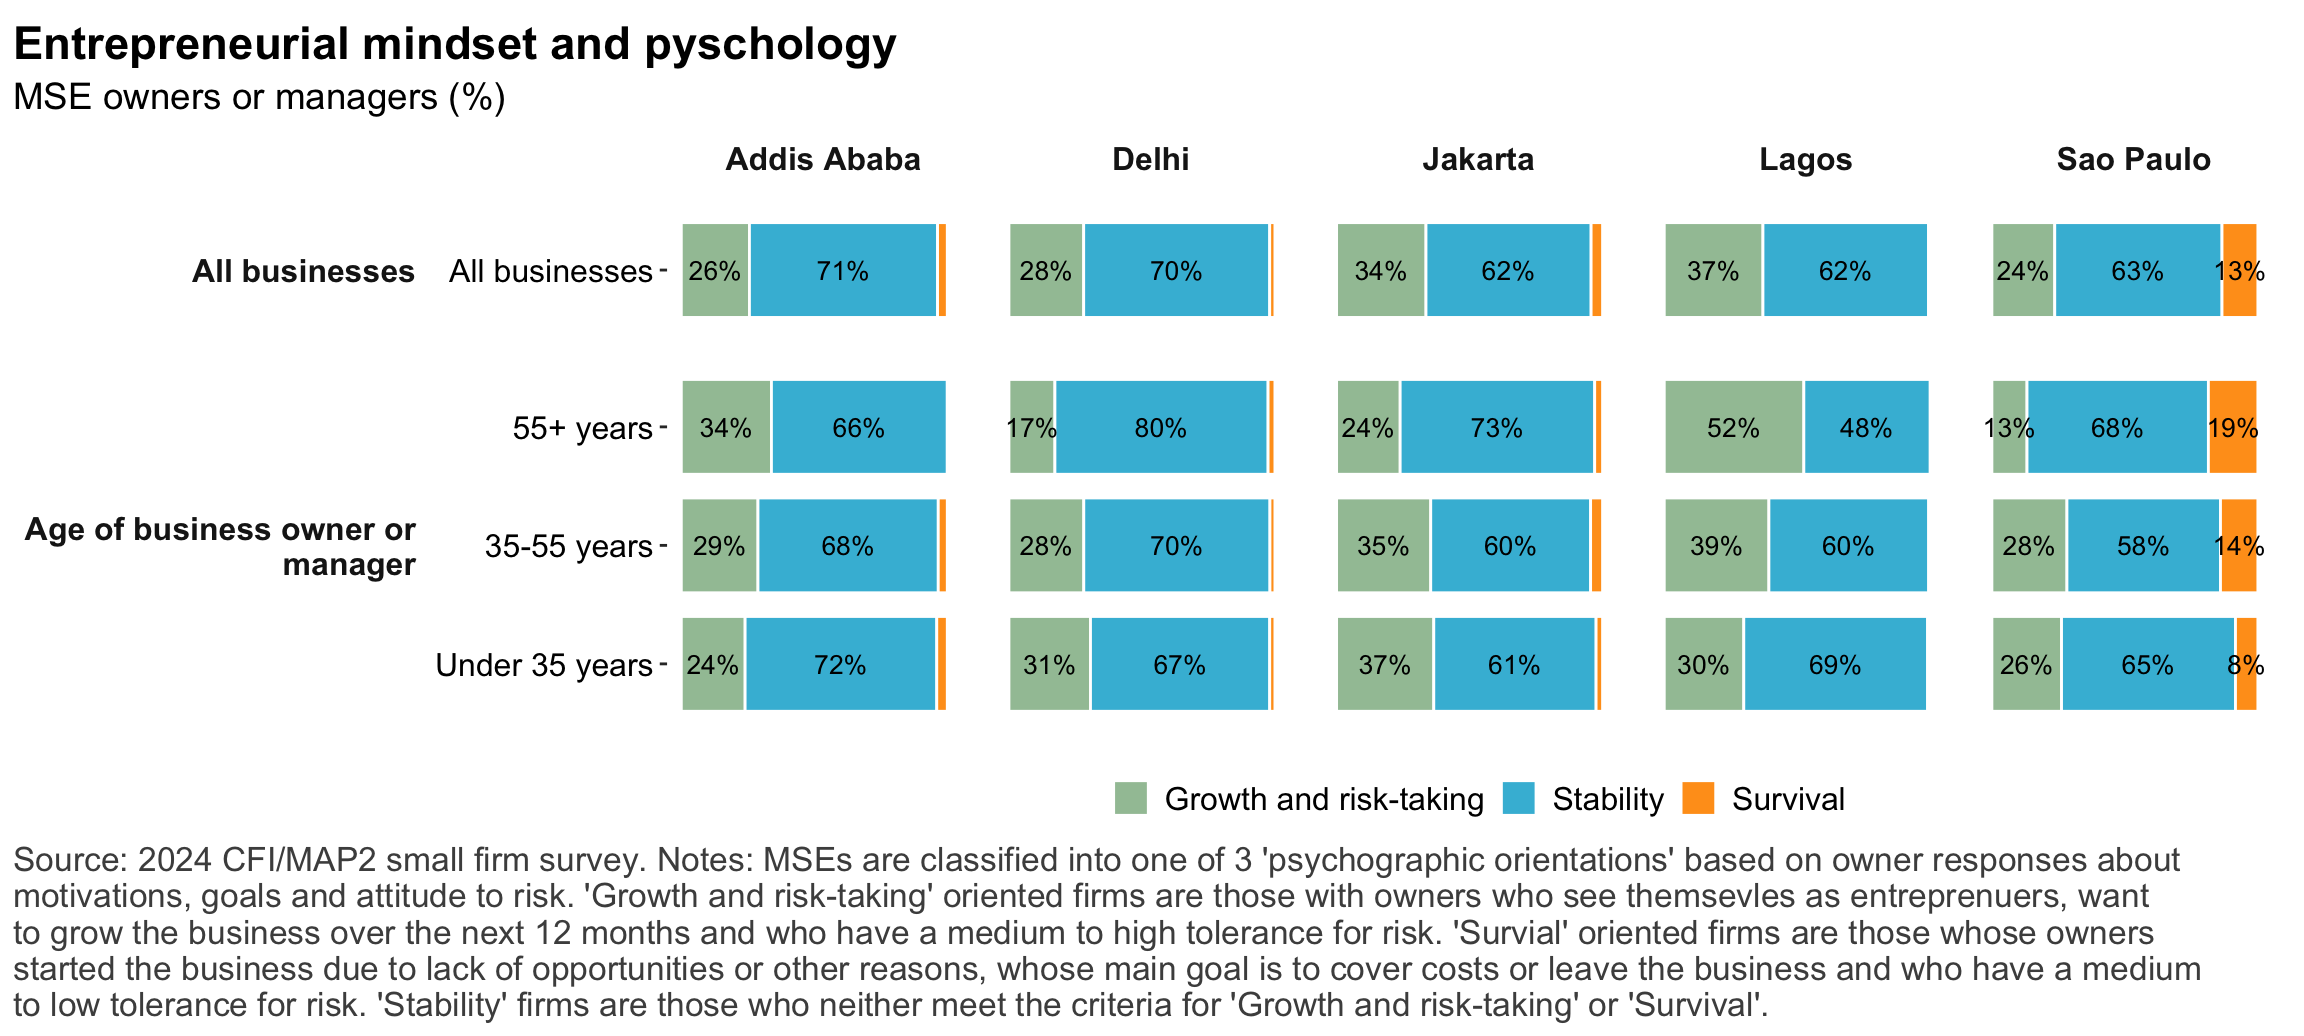
Figure 10: Pyschographic characrteristics of SME owners or managers, by gender
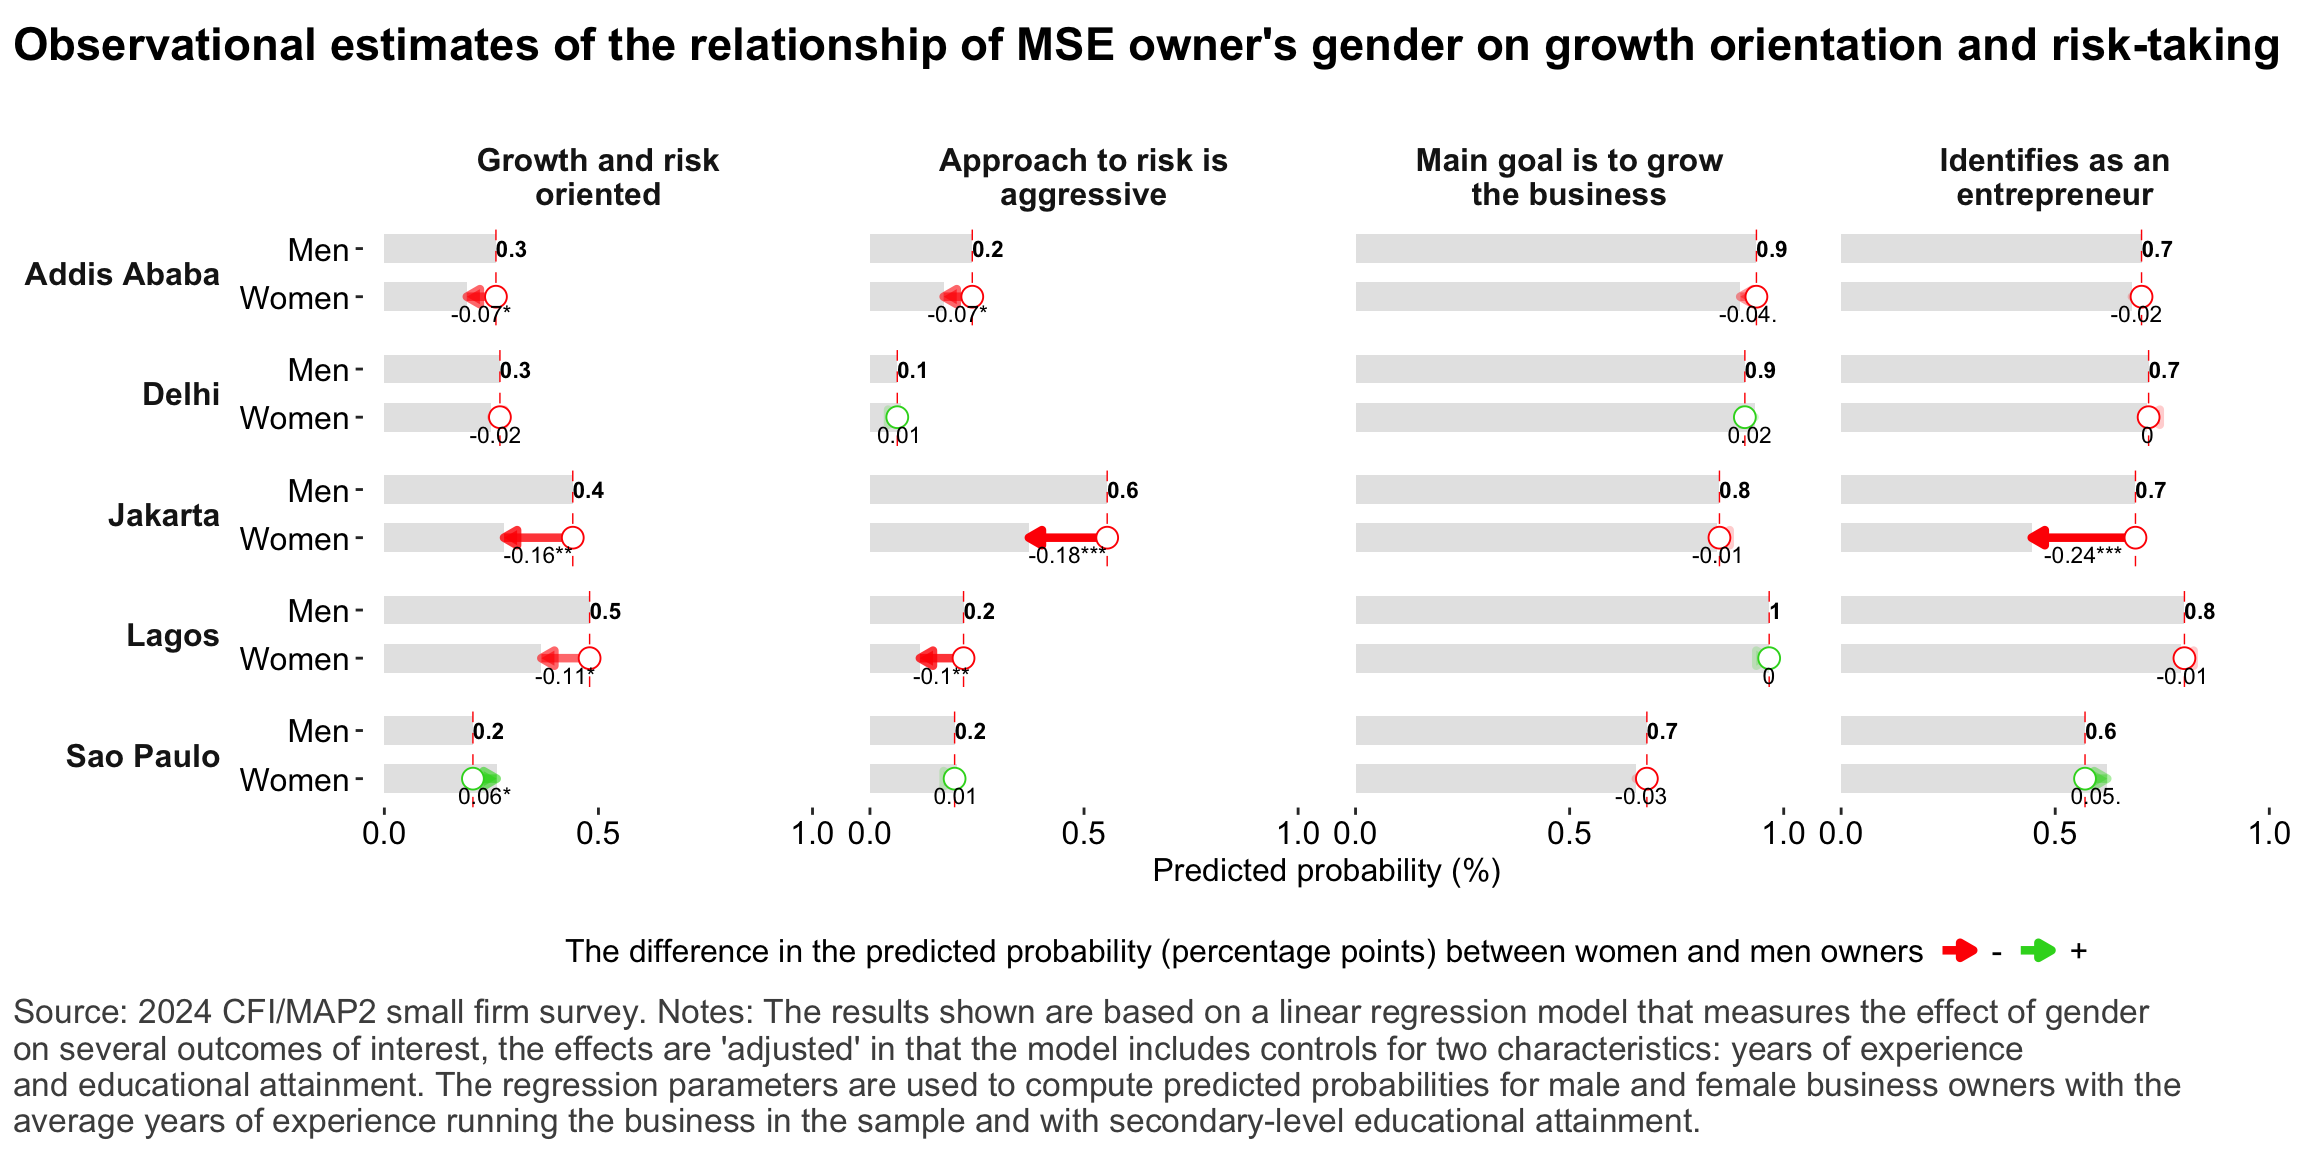
Figure 11: Correlation between owner’s motivations, goals and attitudes to risk
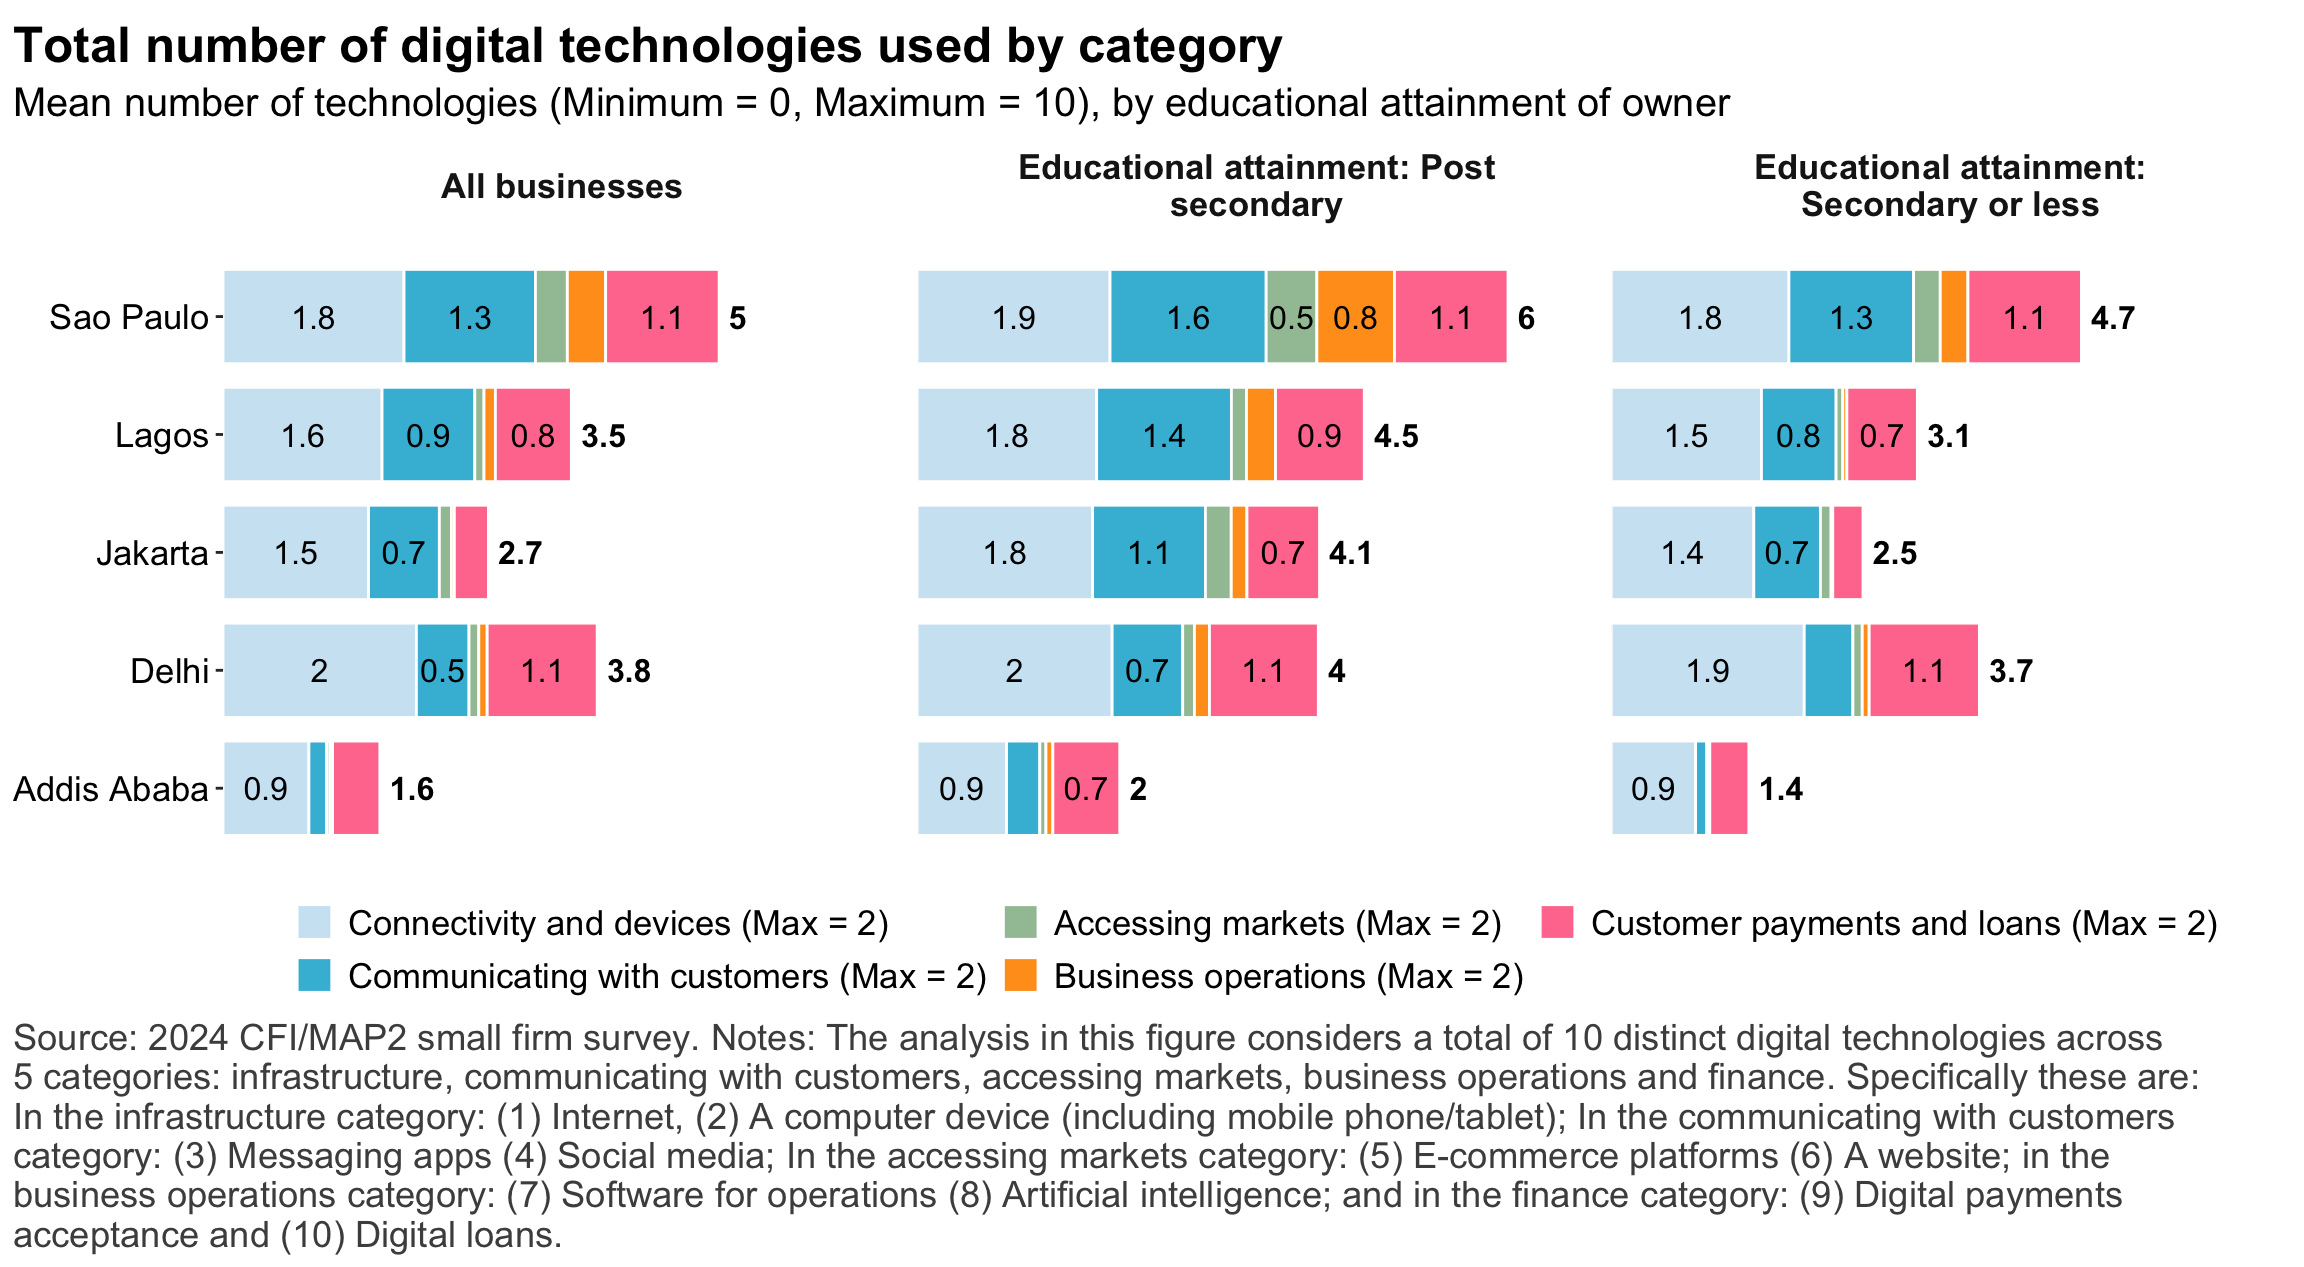
Digital technology strands
Figure 12: Summary measures of financial access
Digital technology
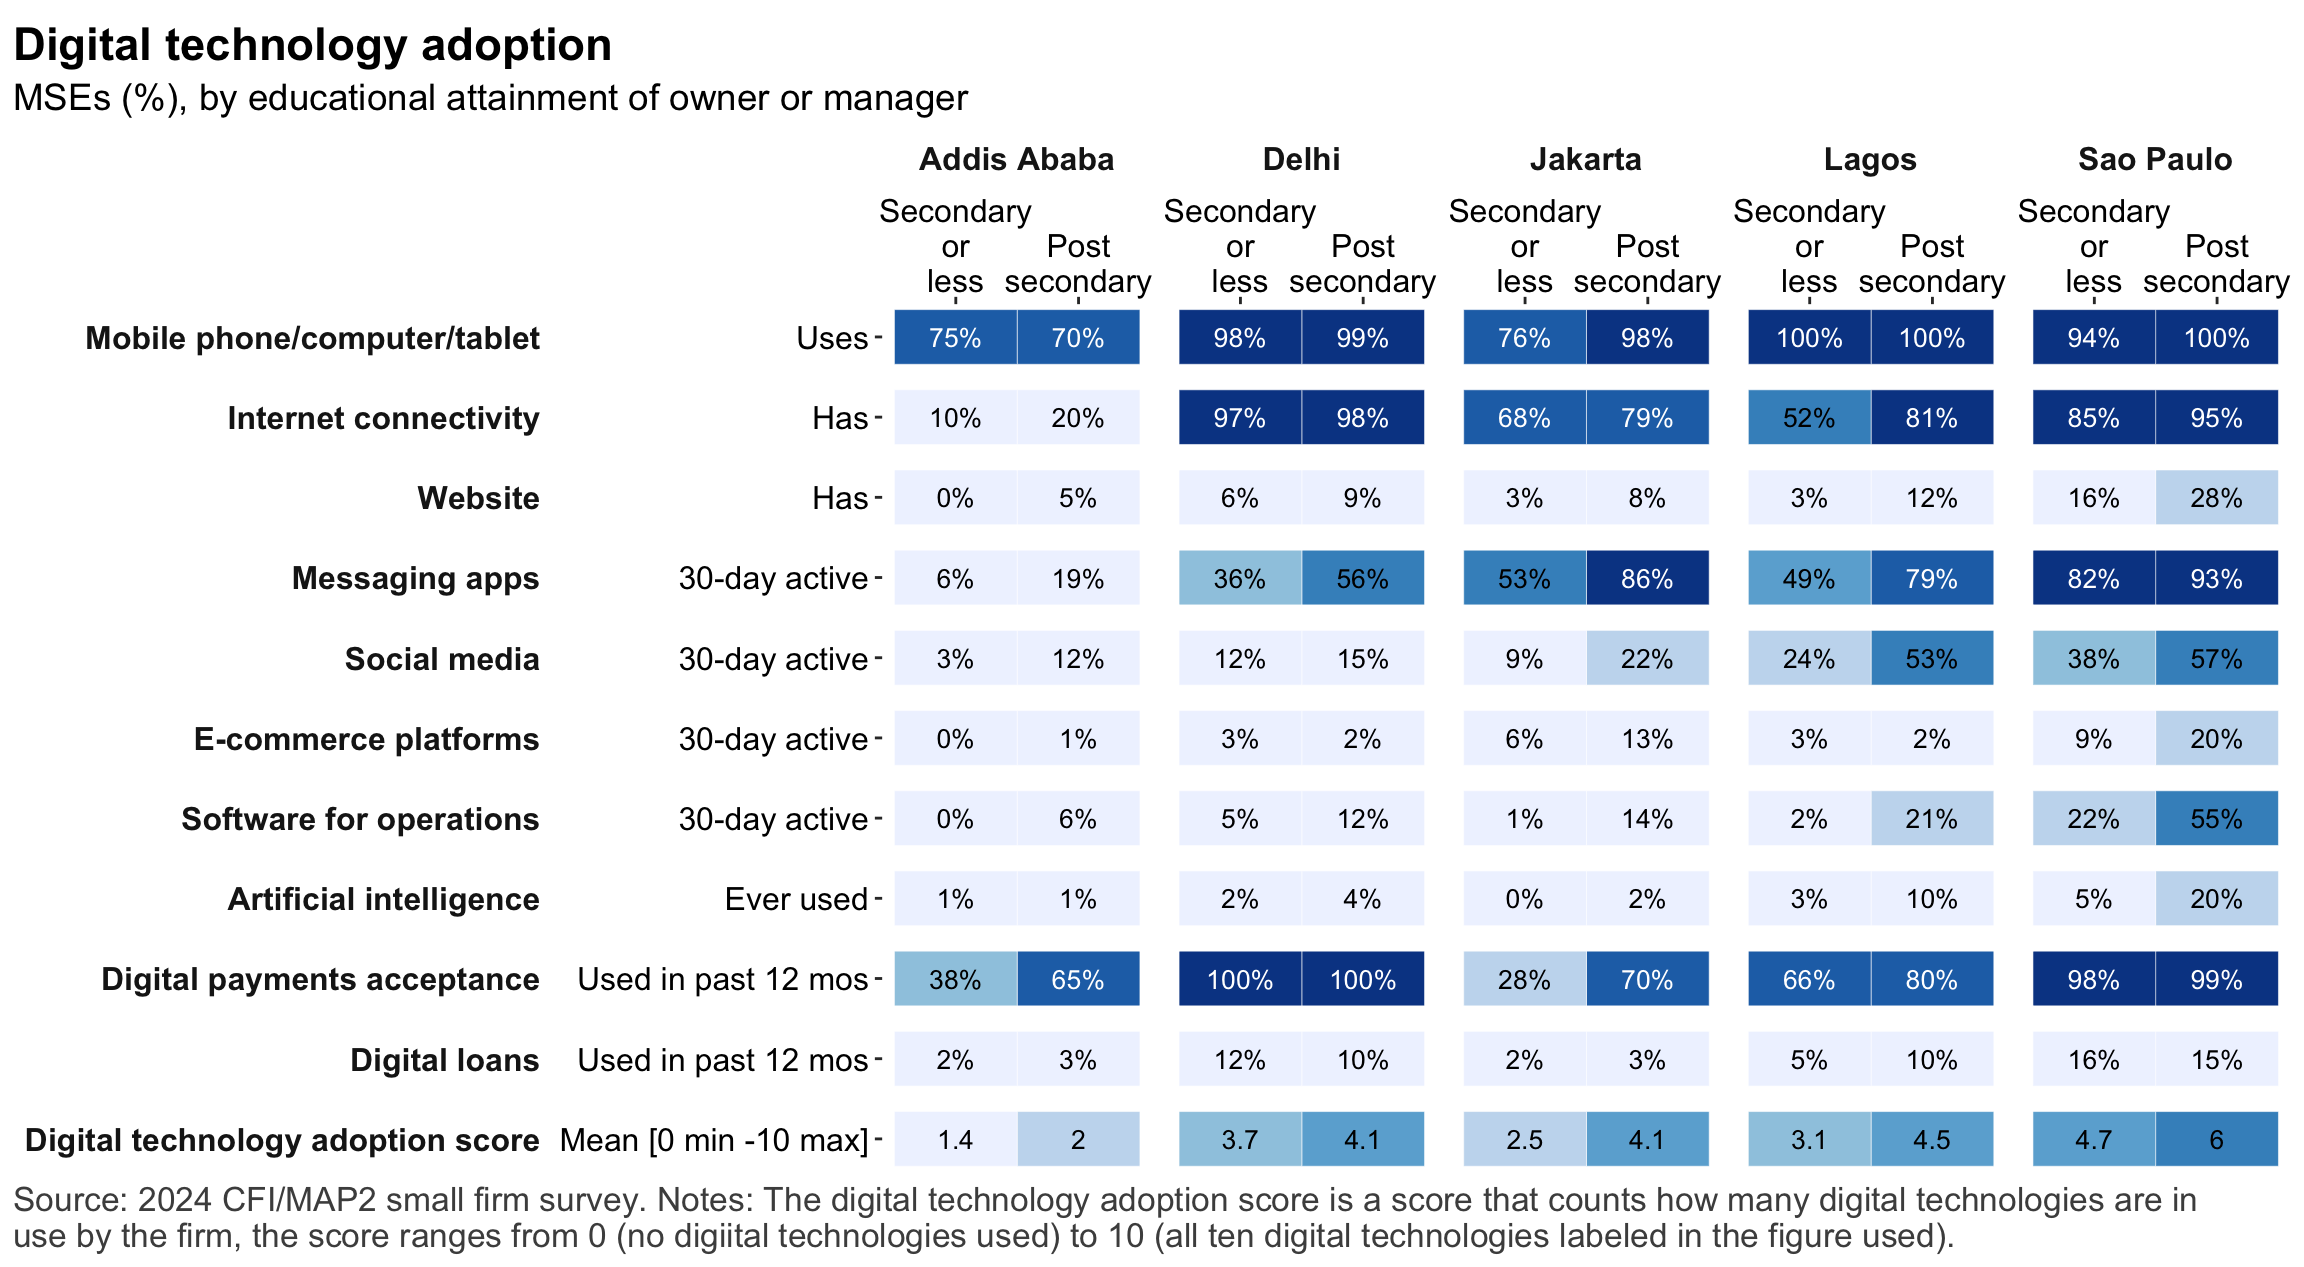
Figure 13: Access to connectivity and devices
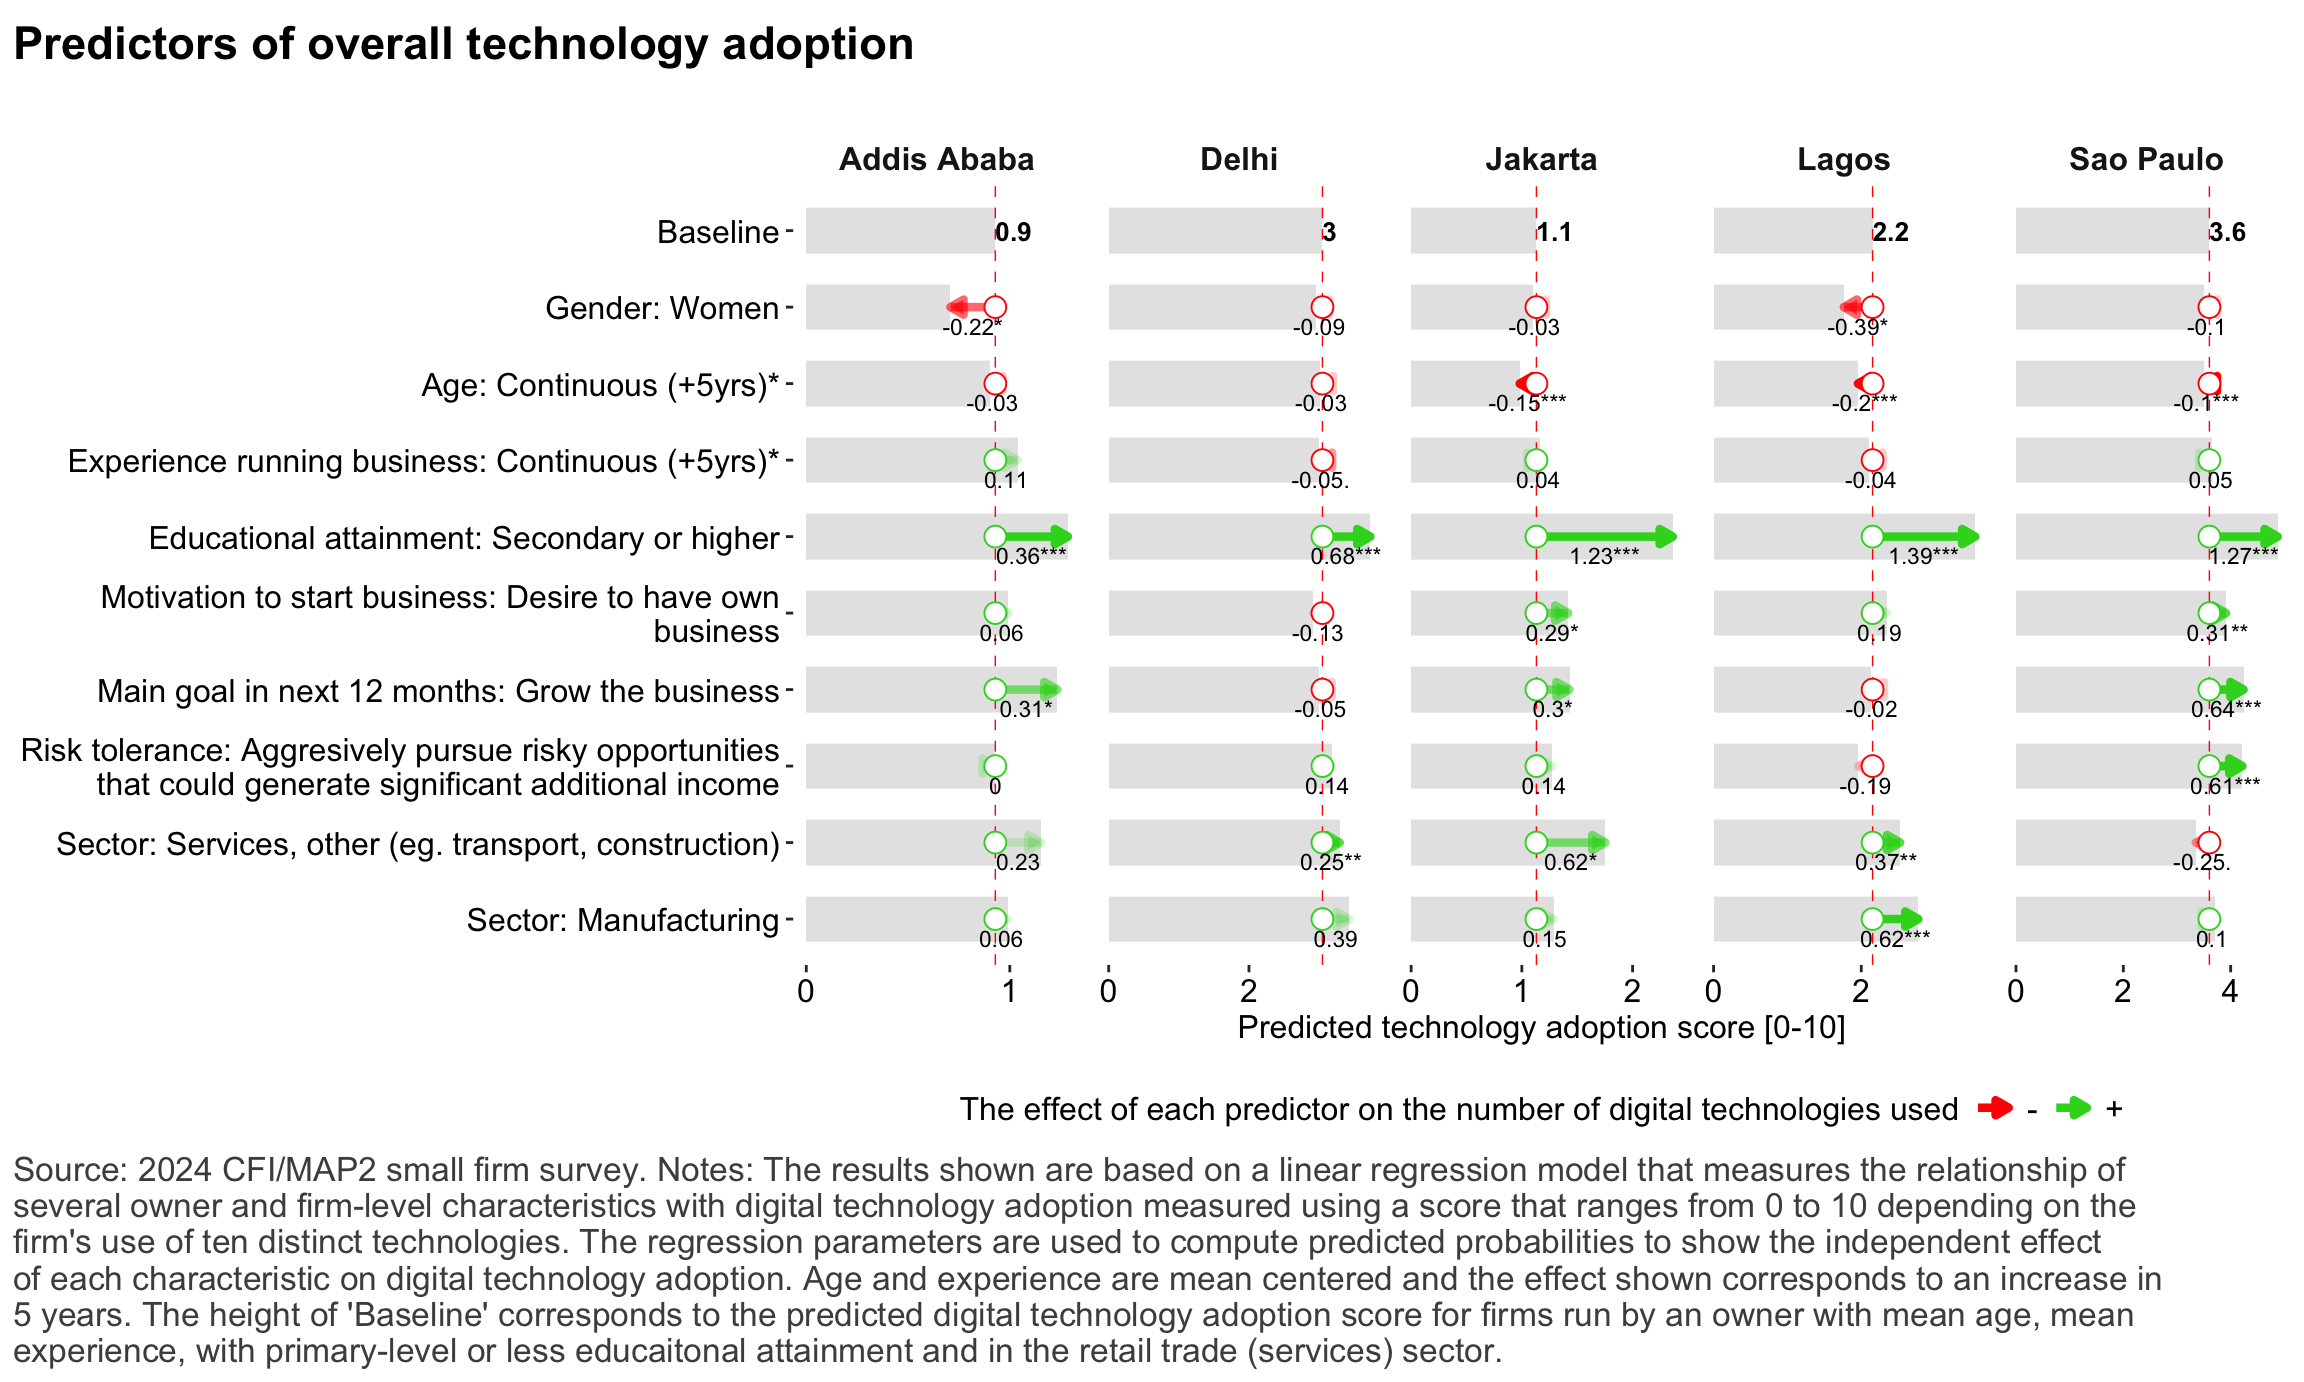
Figure 14: Drivers of overall technology adoption
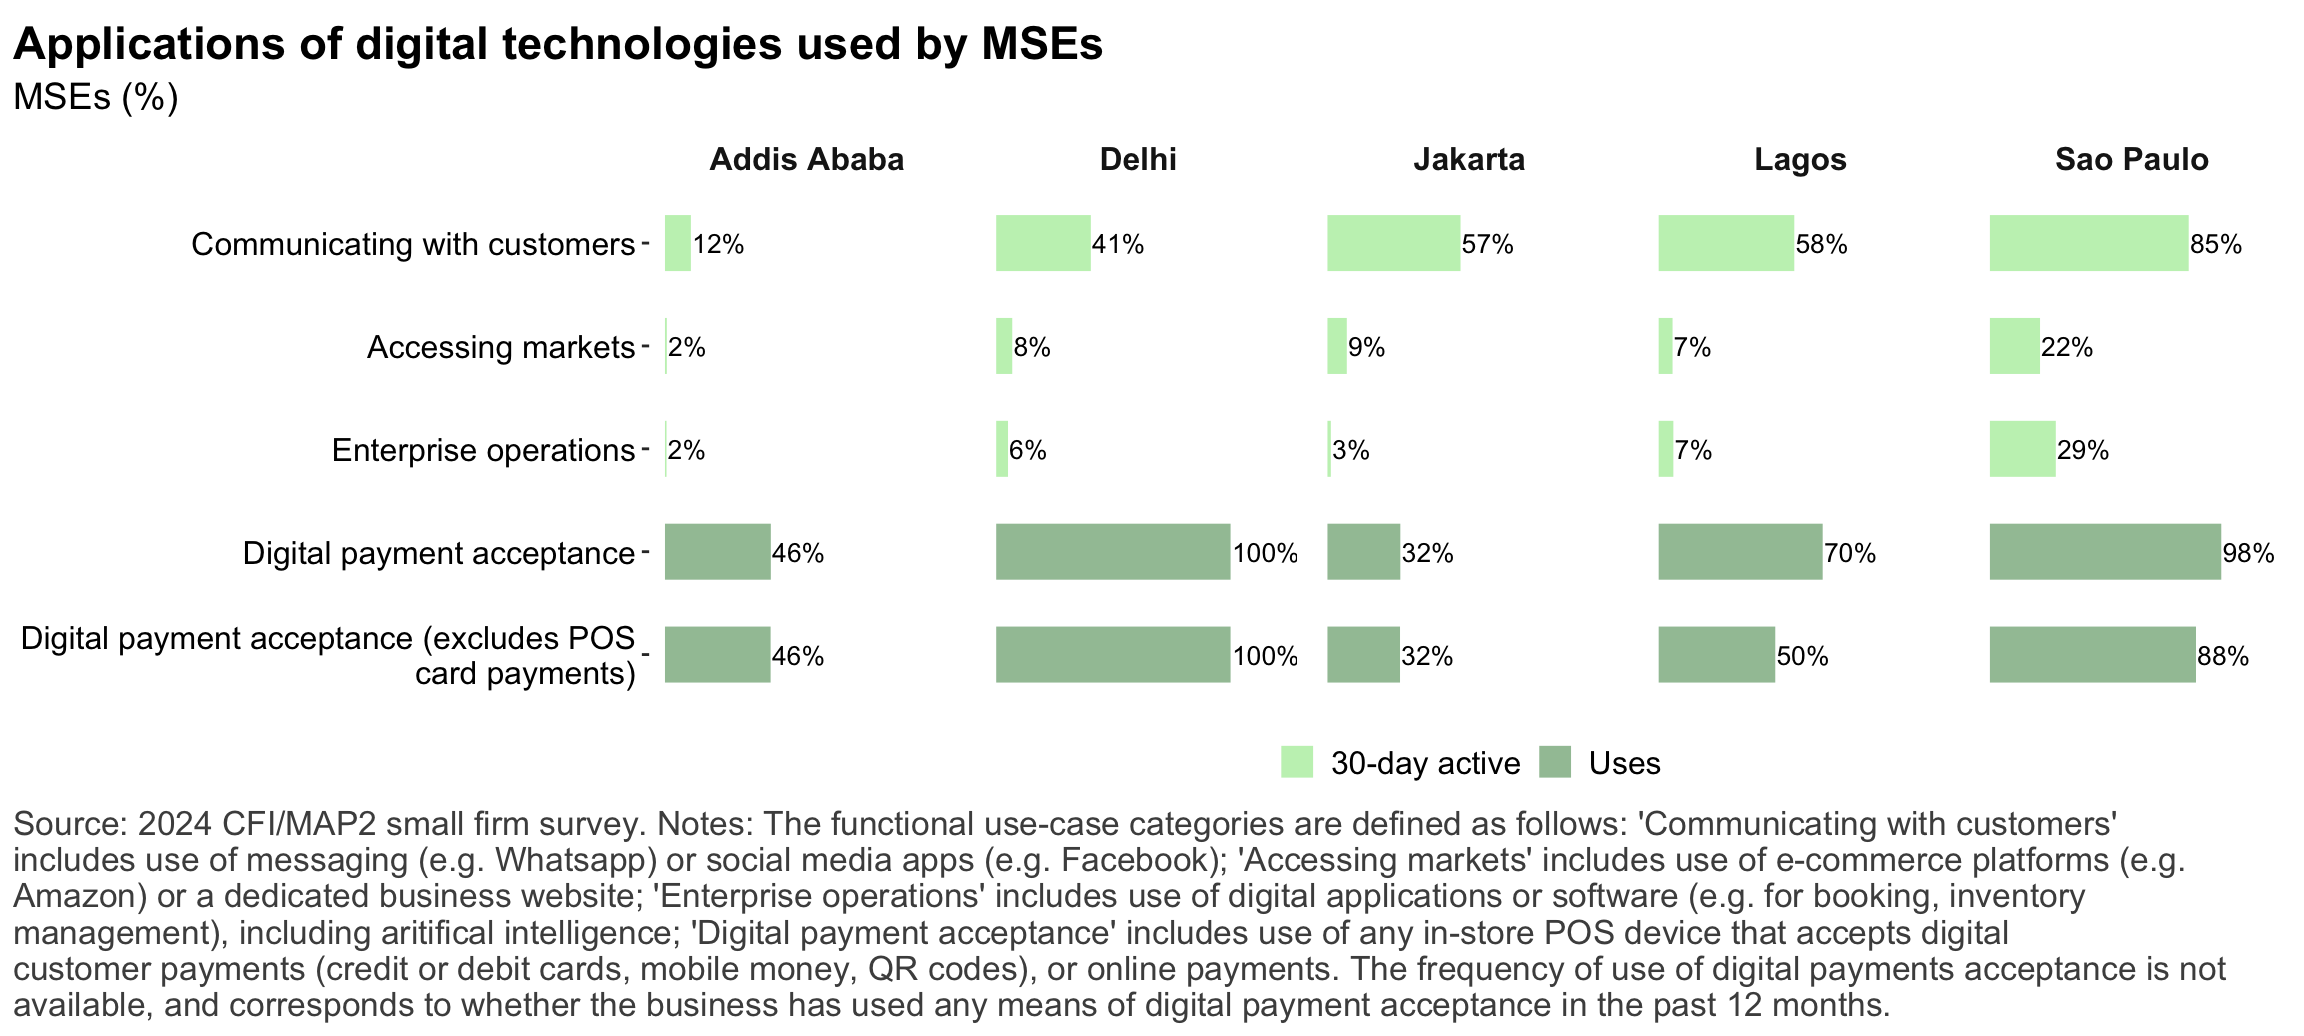
Figure 15: Applications of digital technology
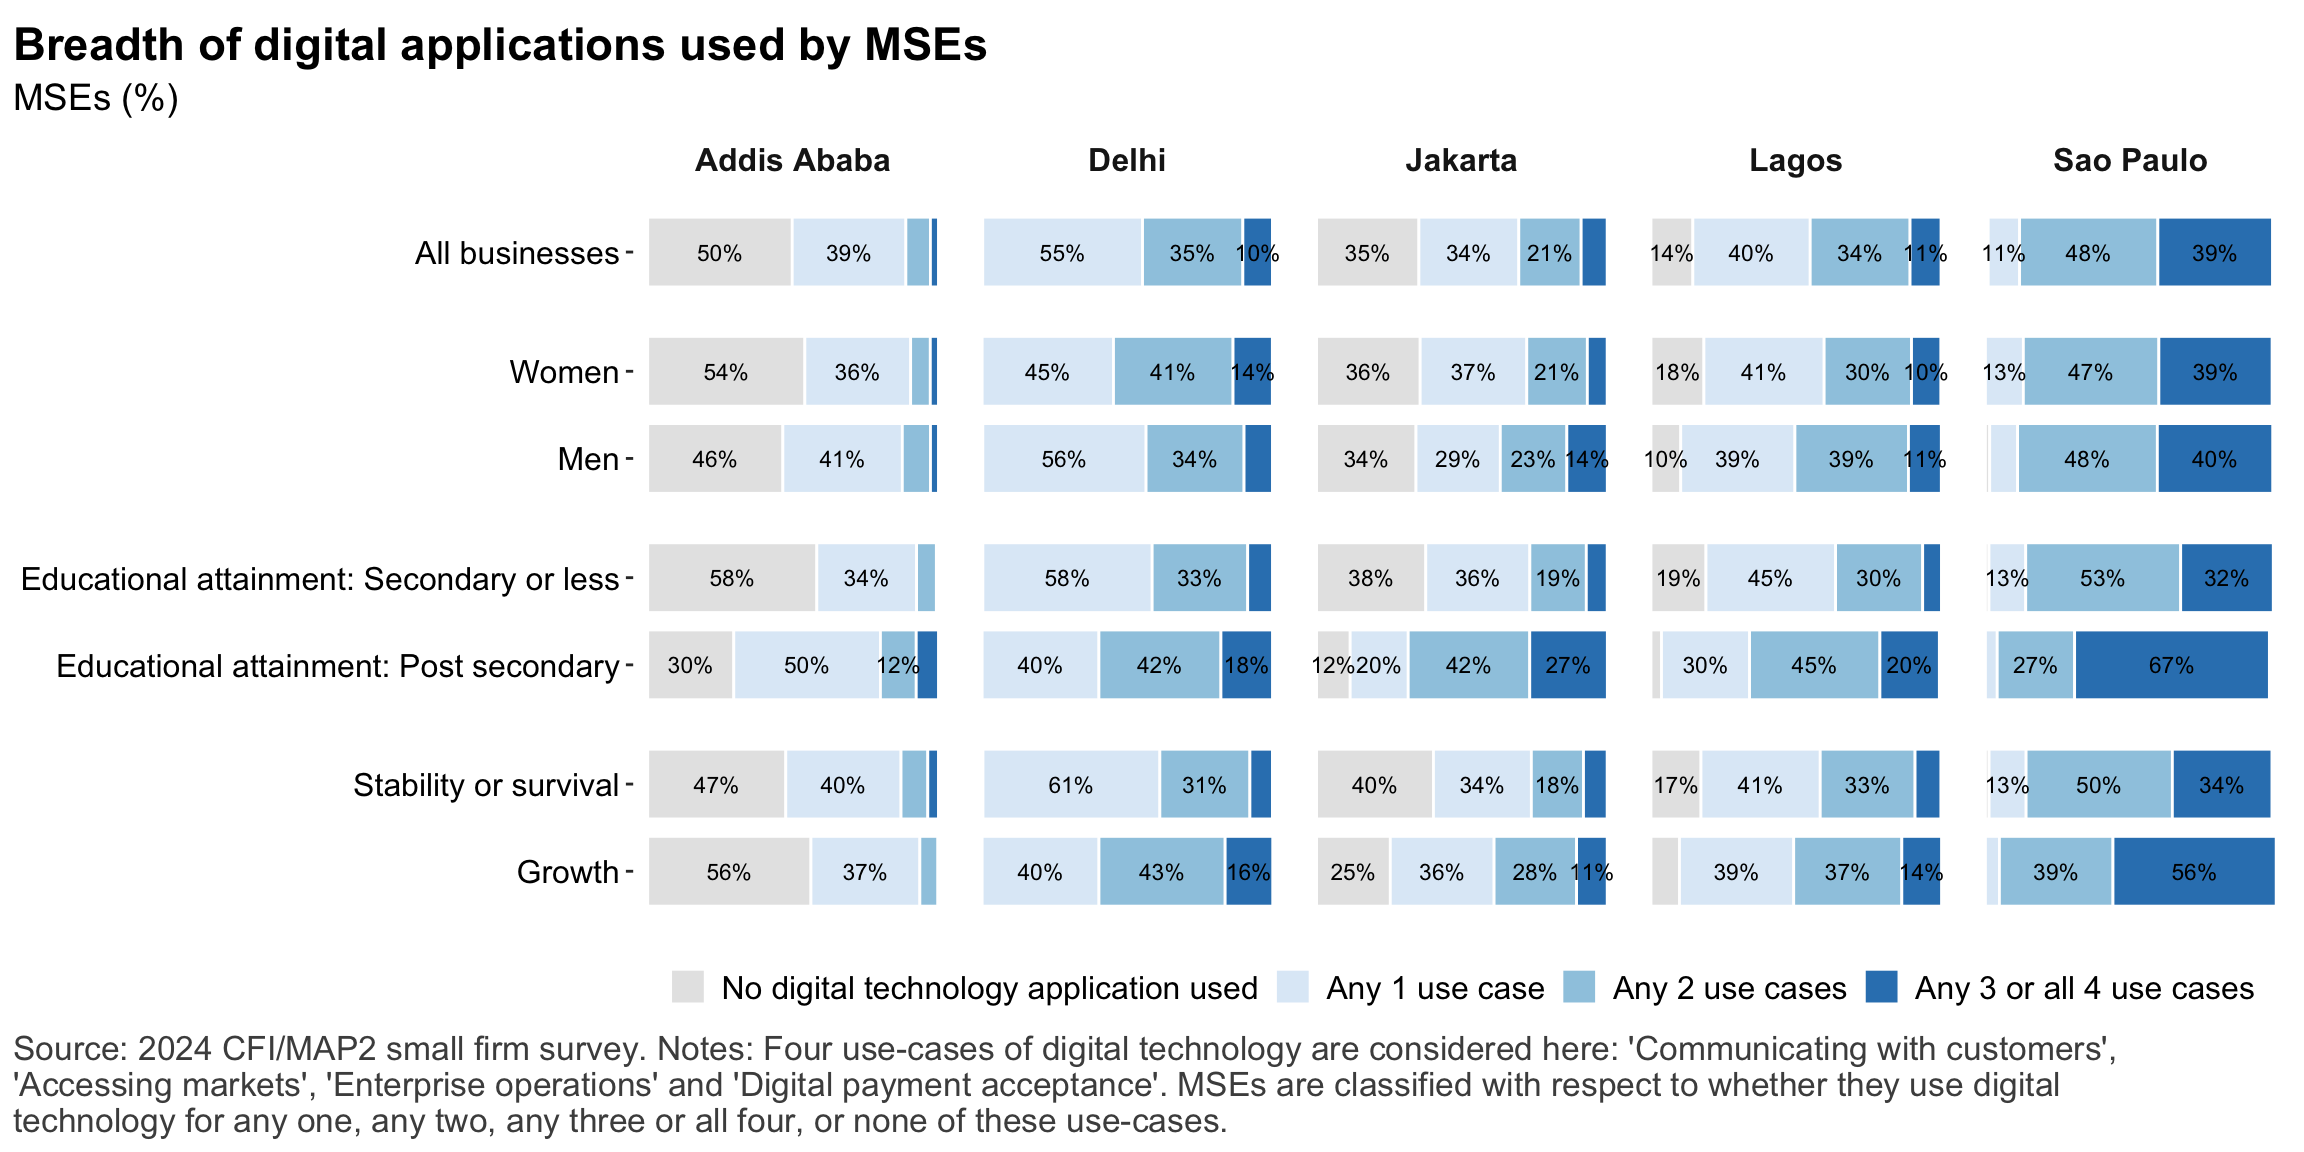
Figure 16: Depth of digital technology adoption
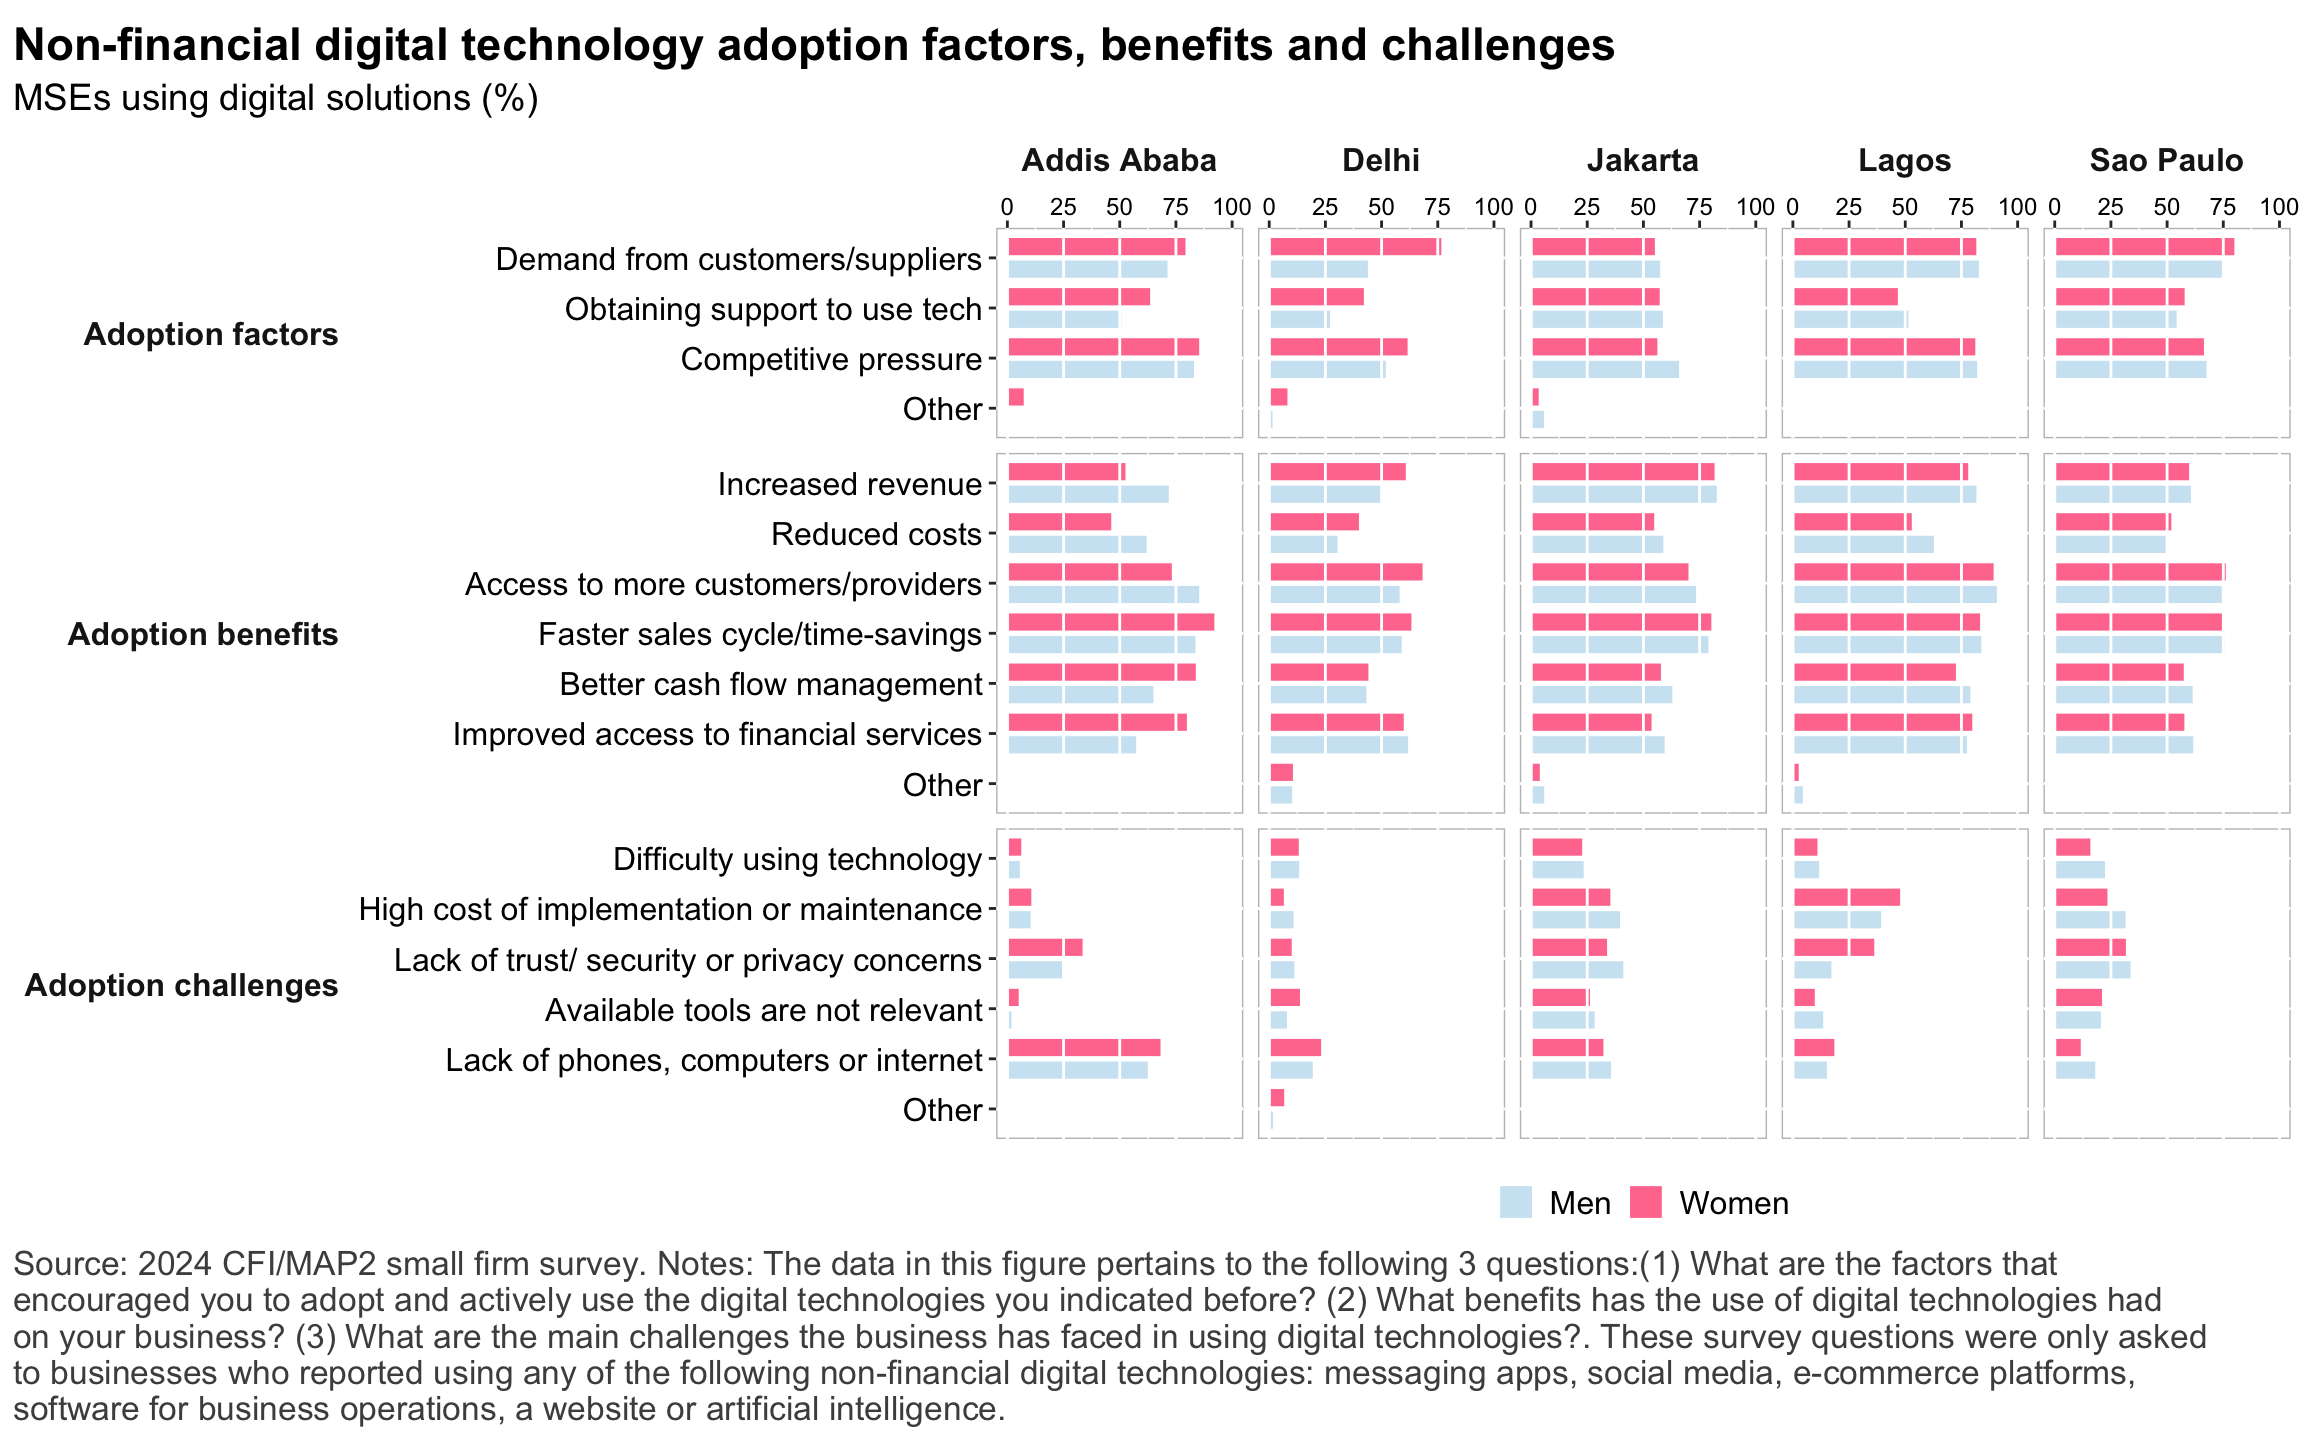
Figure 17: Non-financial digital technology adoption factors
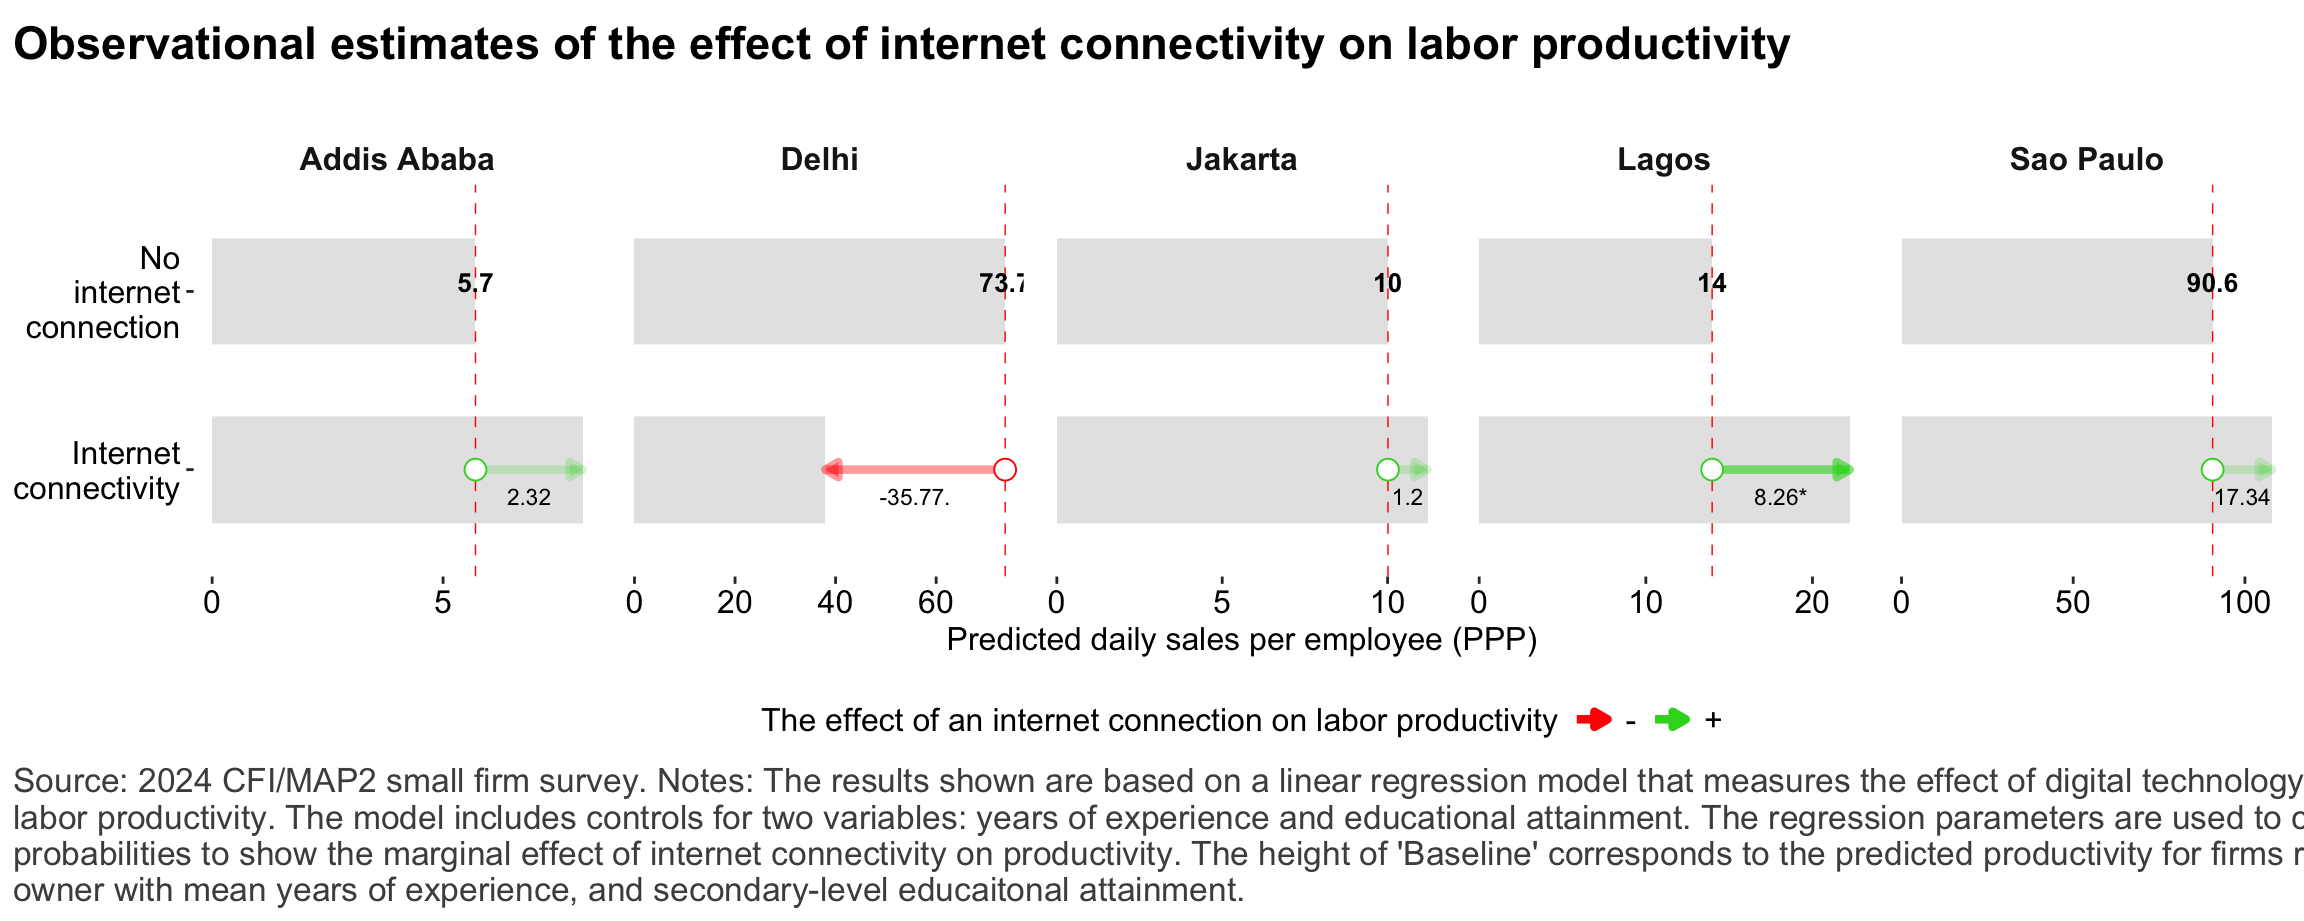
Figure 18: Relationship between internet-connectivity and firm-level labor productivity
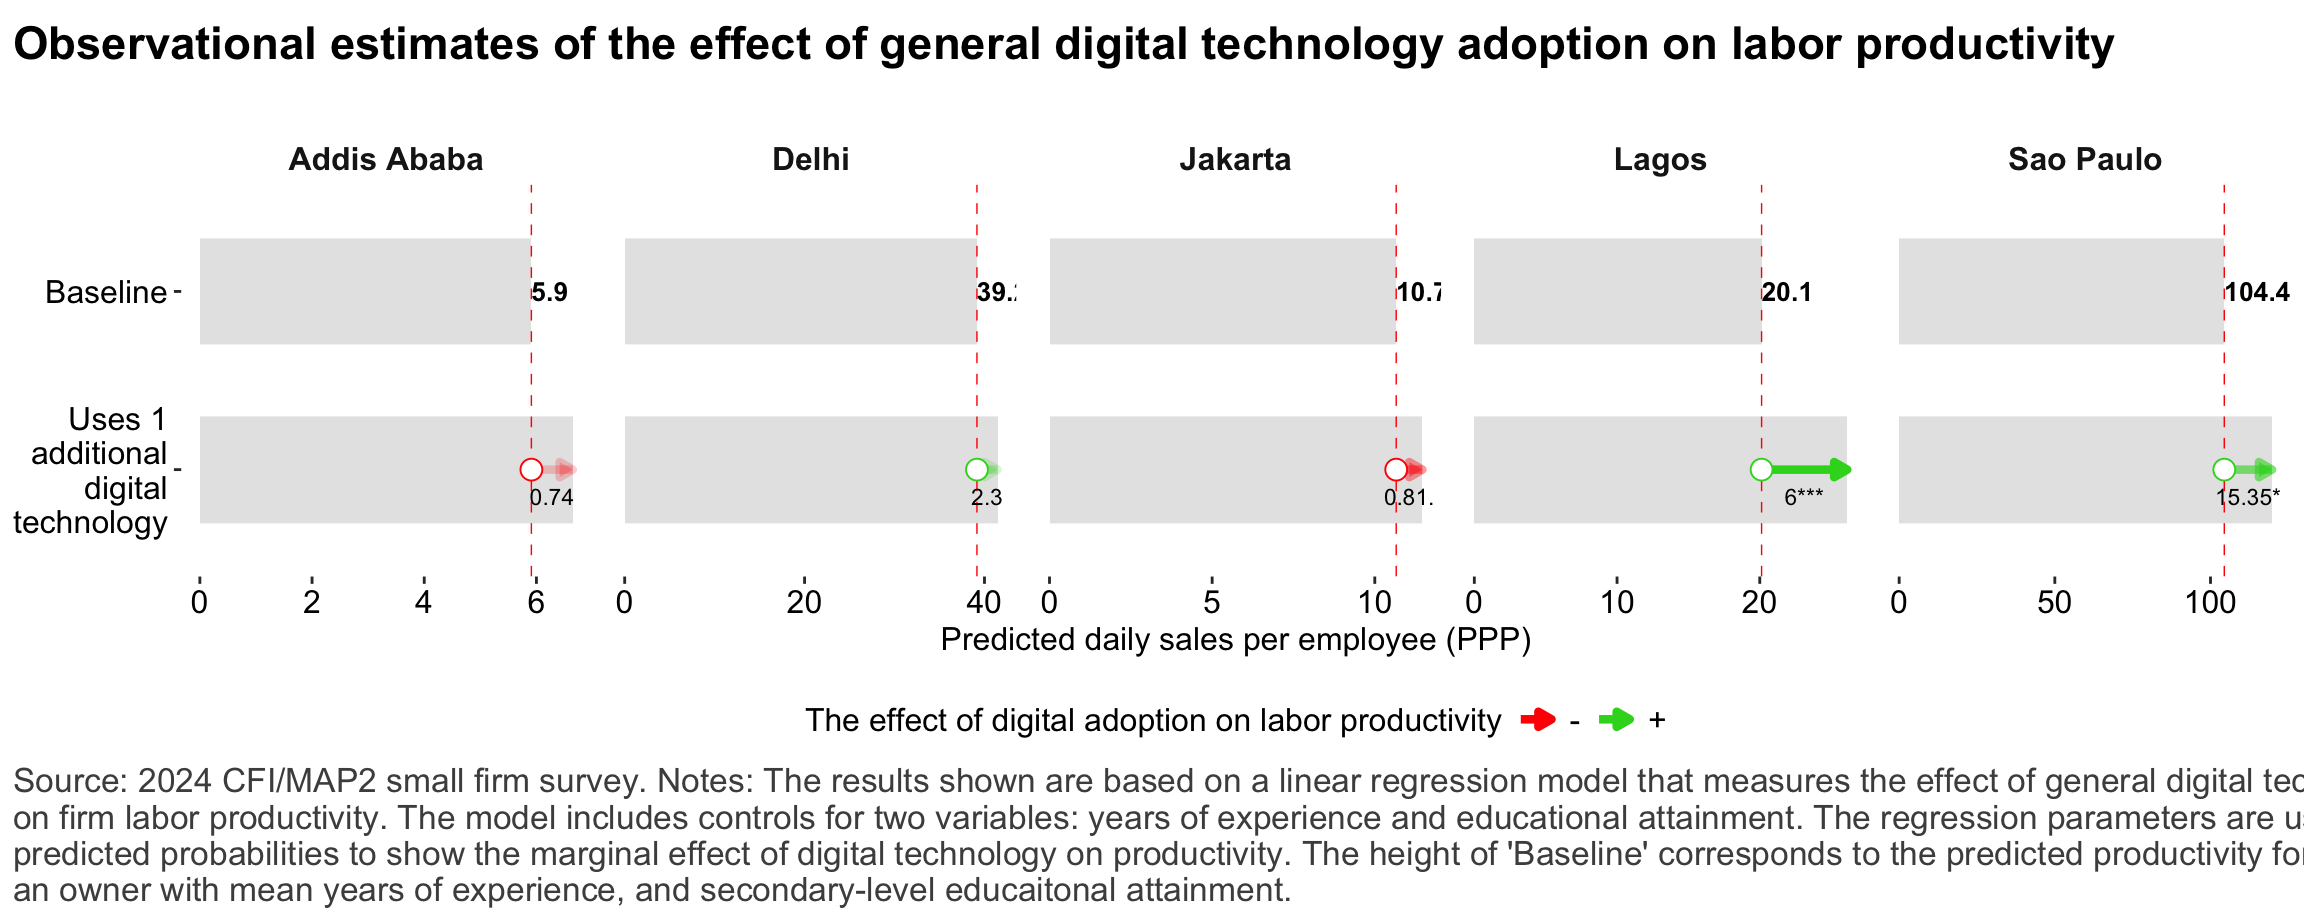
Figure 19: Relationship between digital technology and firm-level labor productivity
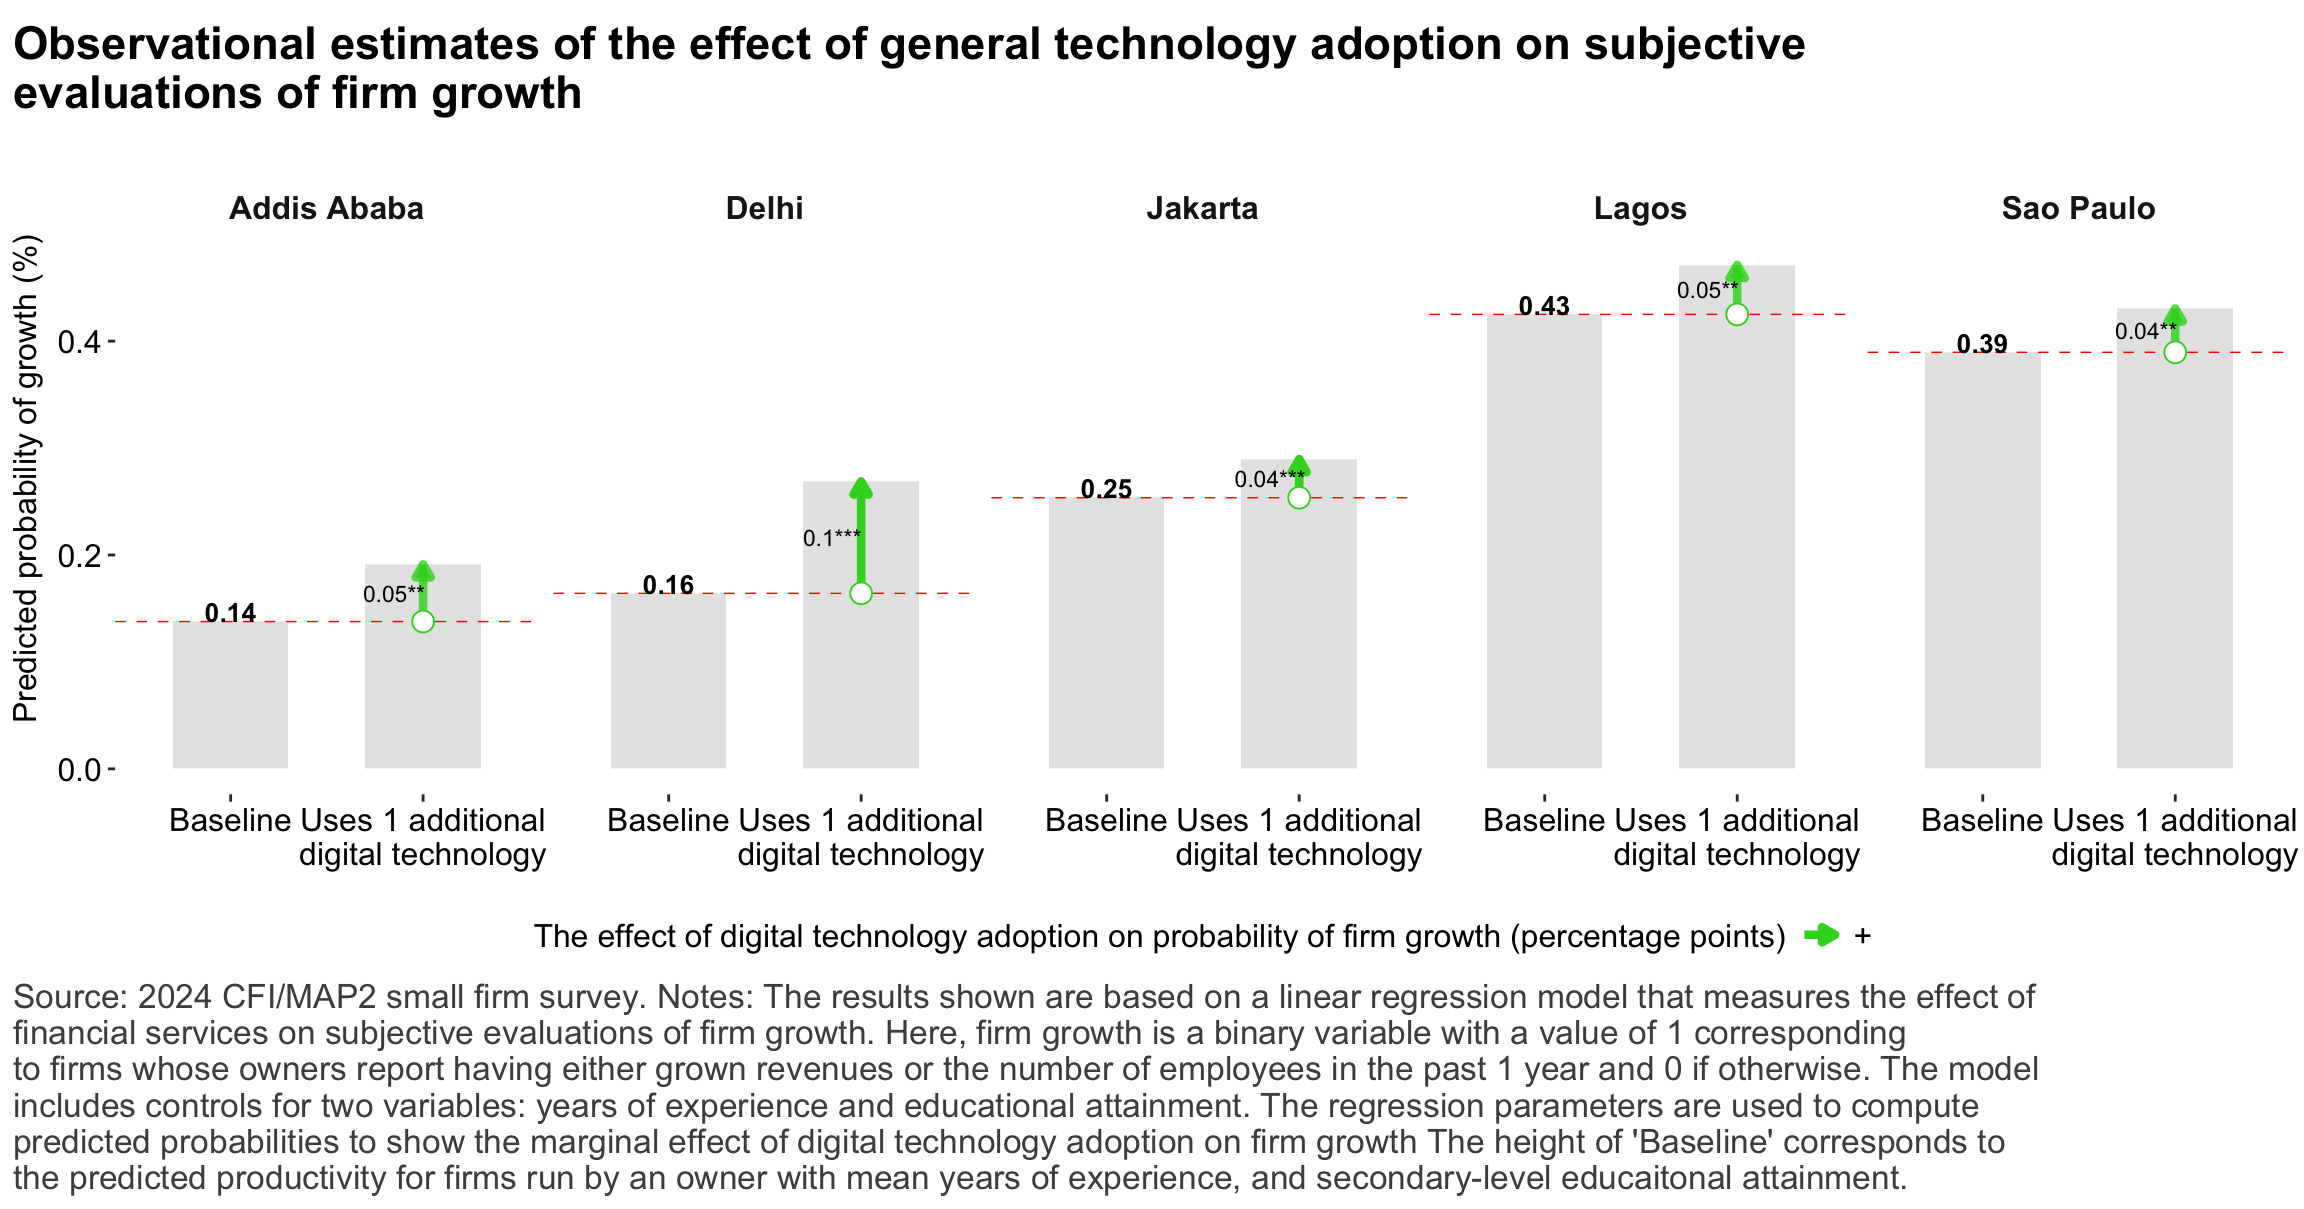
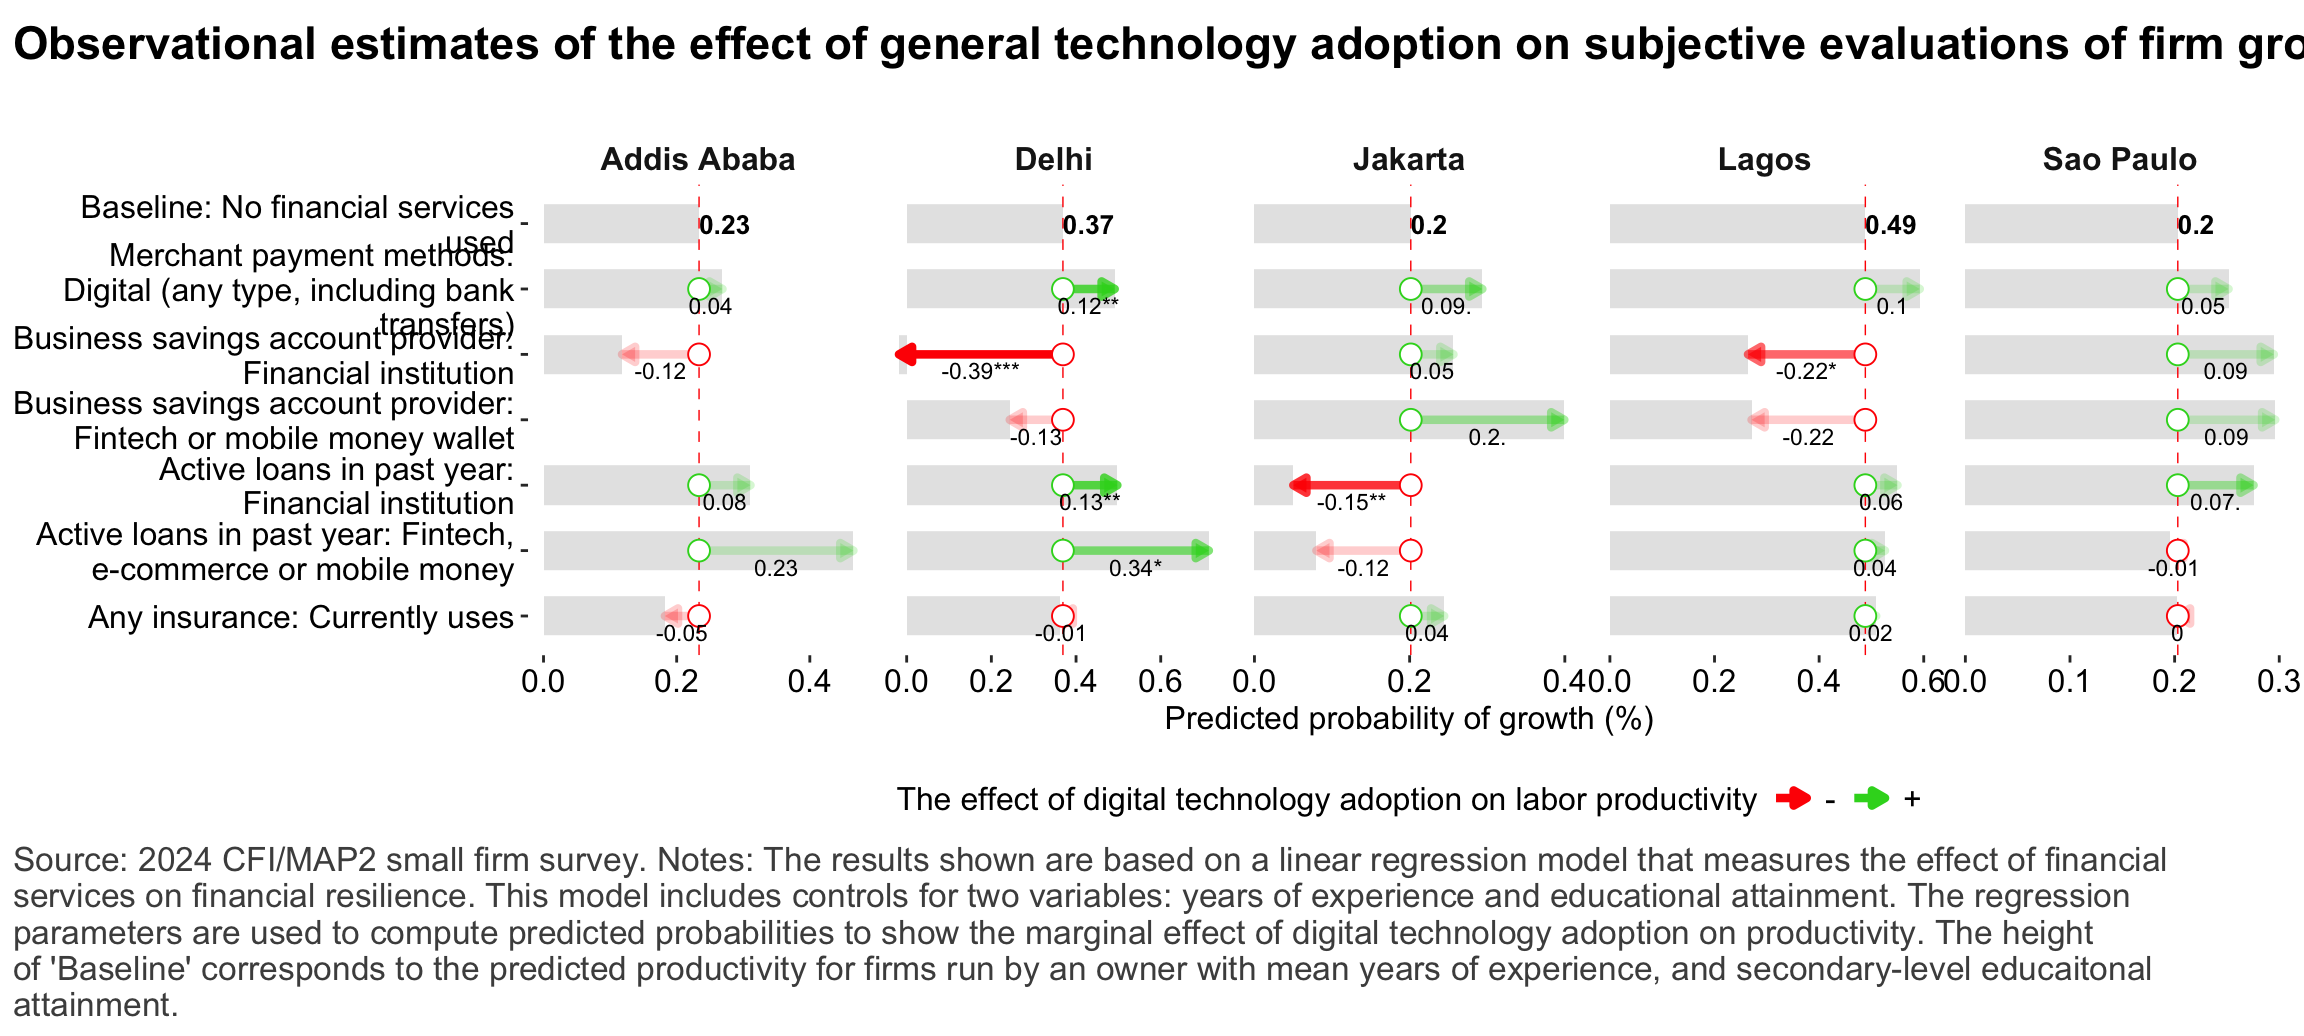
Figure 20: Relationship between general digital technology adoption and subjective growth
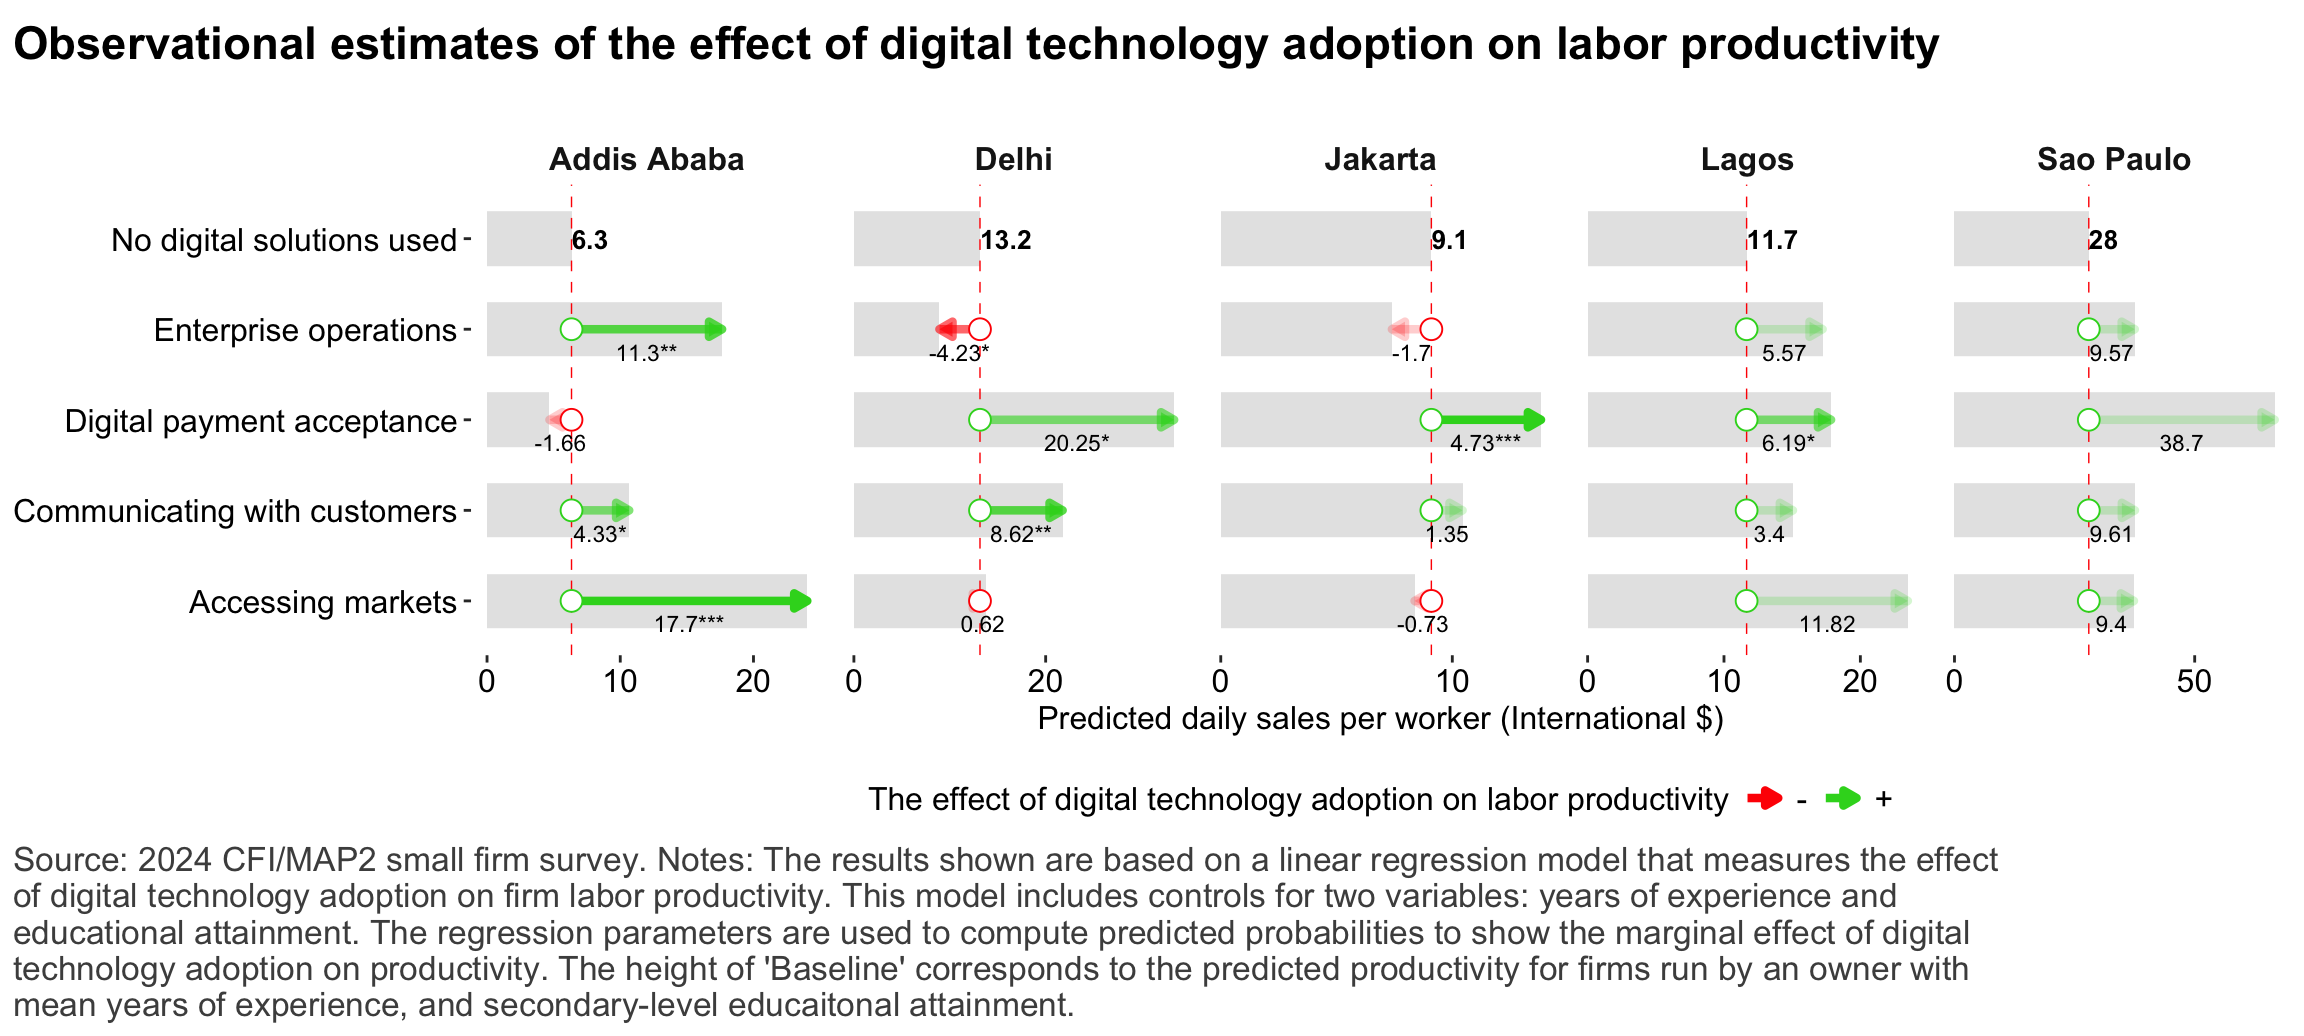
Figure 21: Relationship between digital technology adoption and firm-level labor productivity
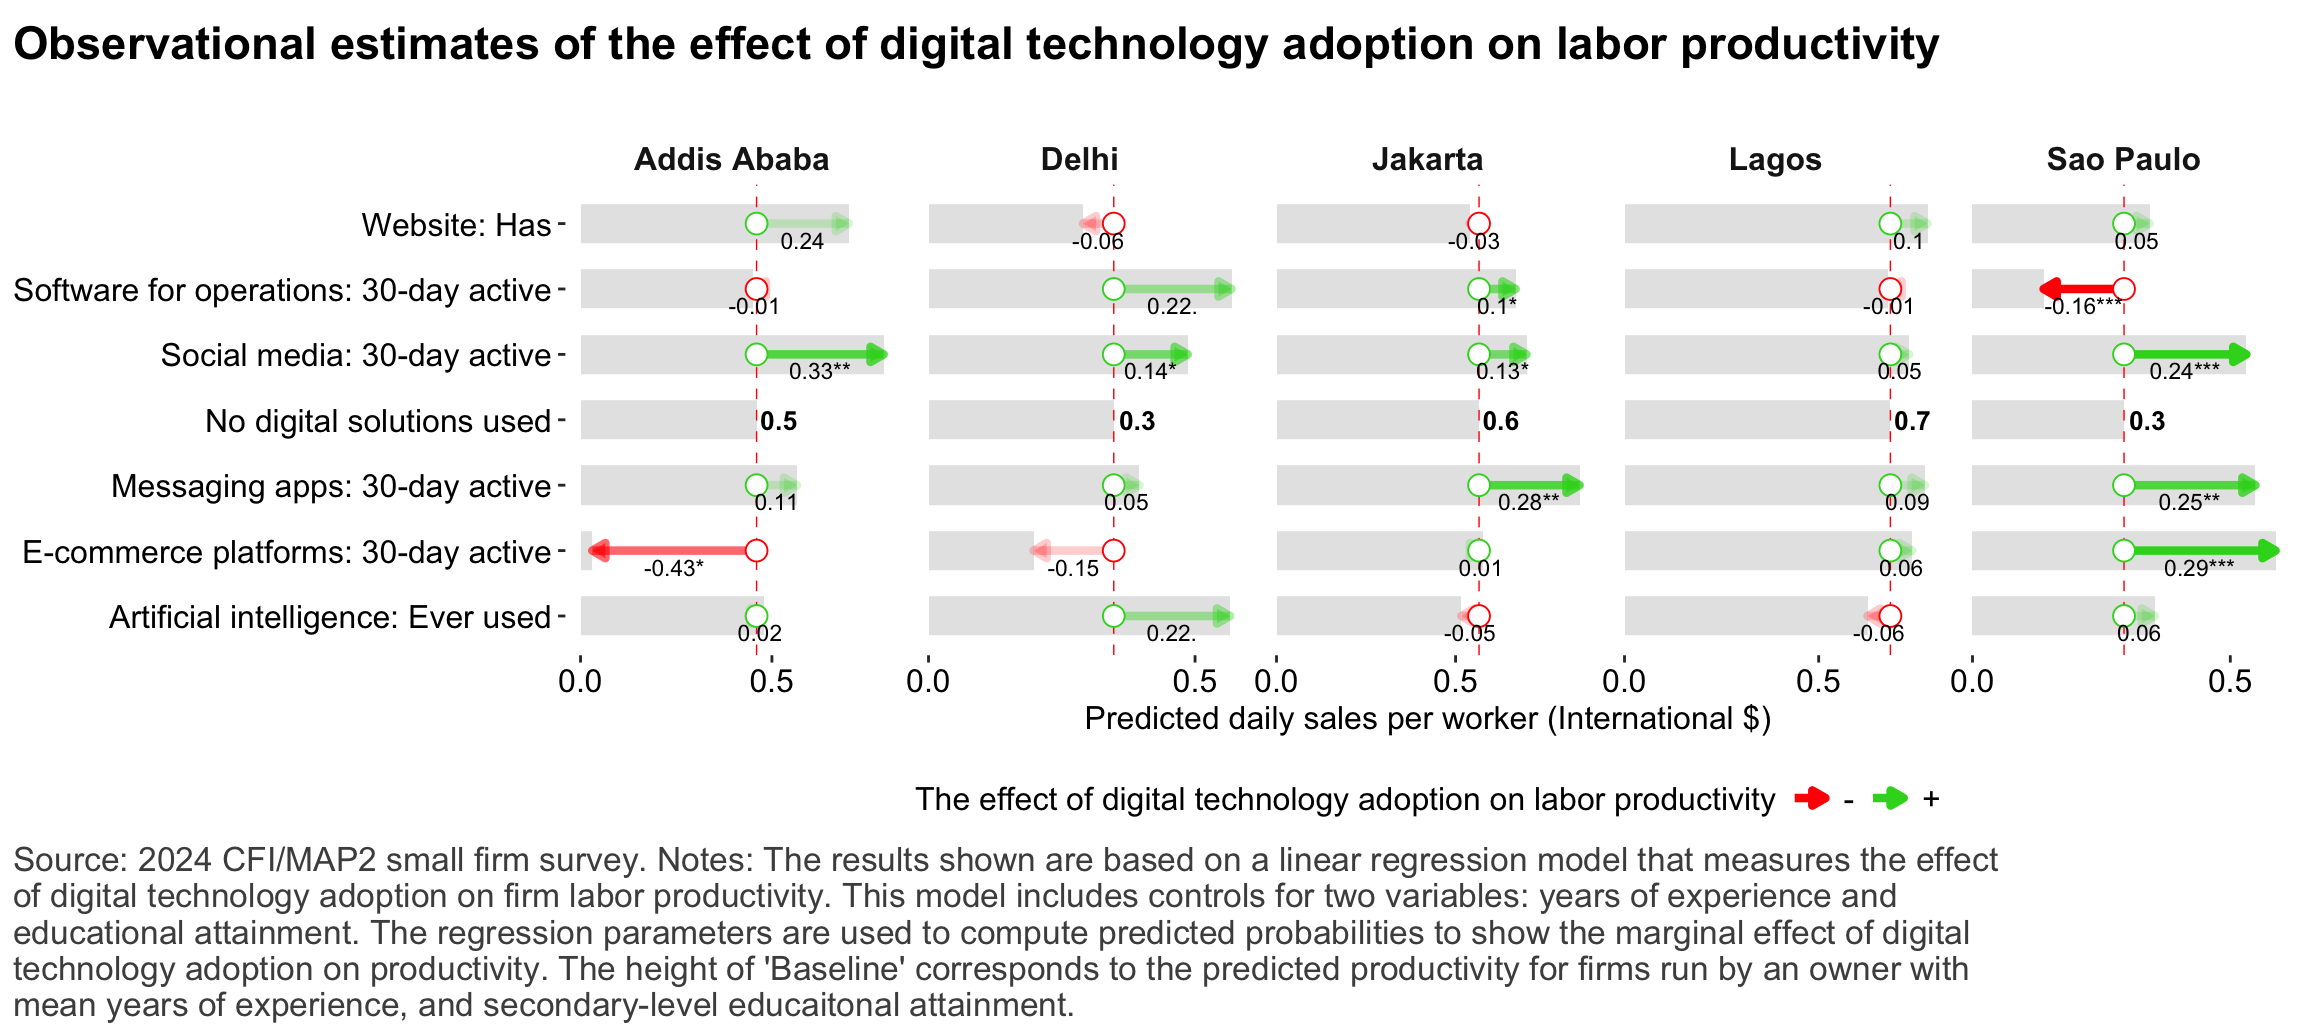
Figure 22: Relationship between digital technology adoption and firm-level labor productivity
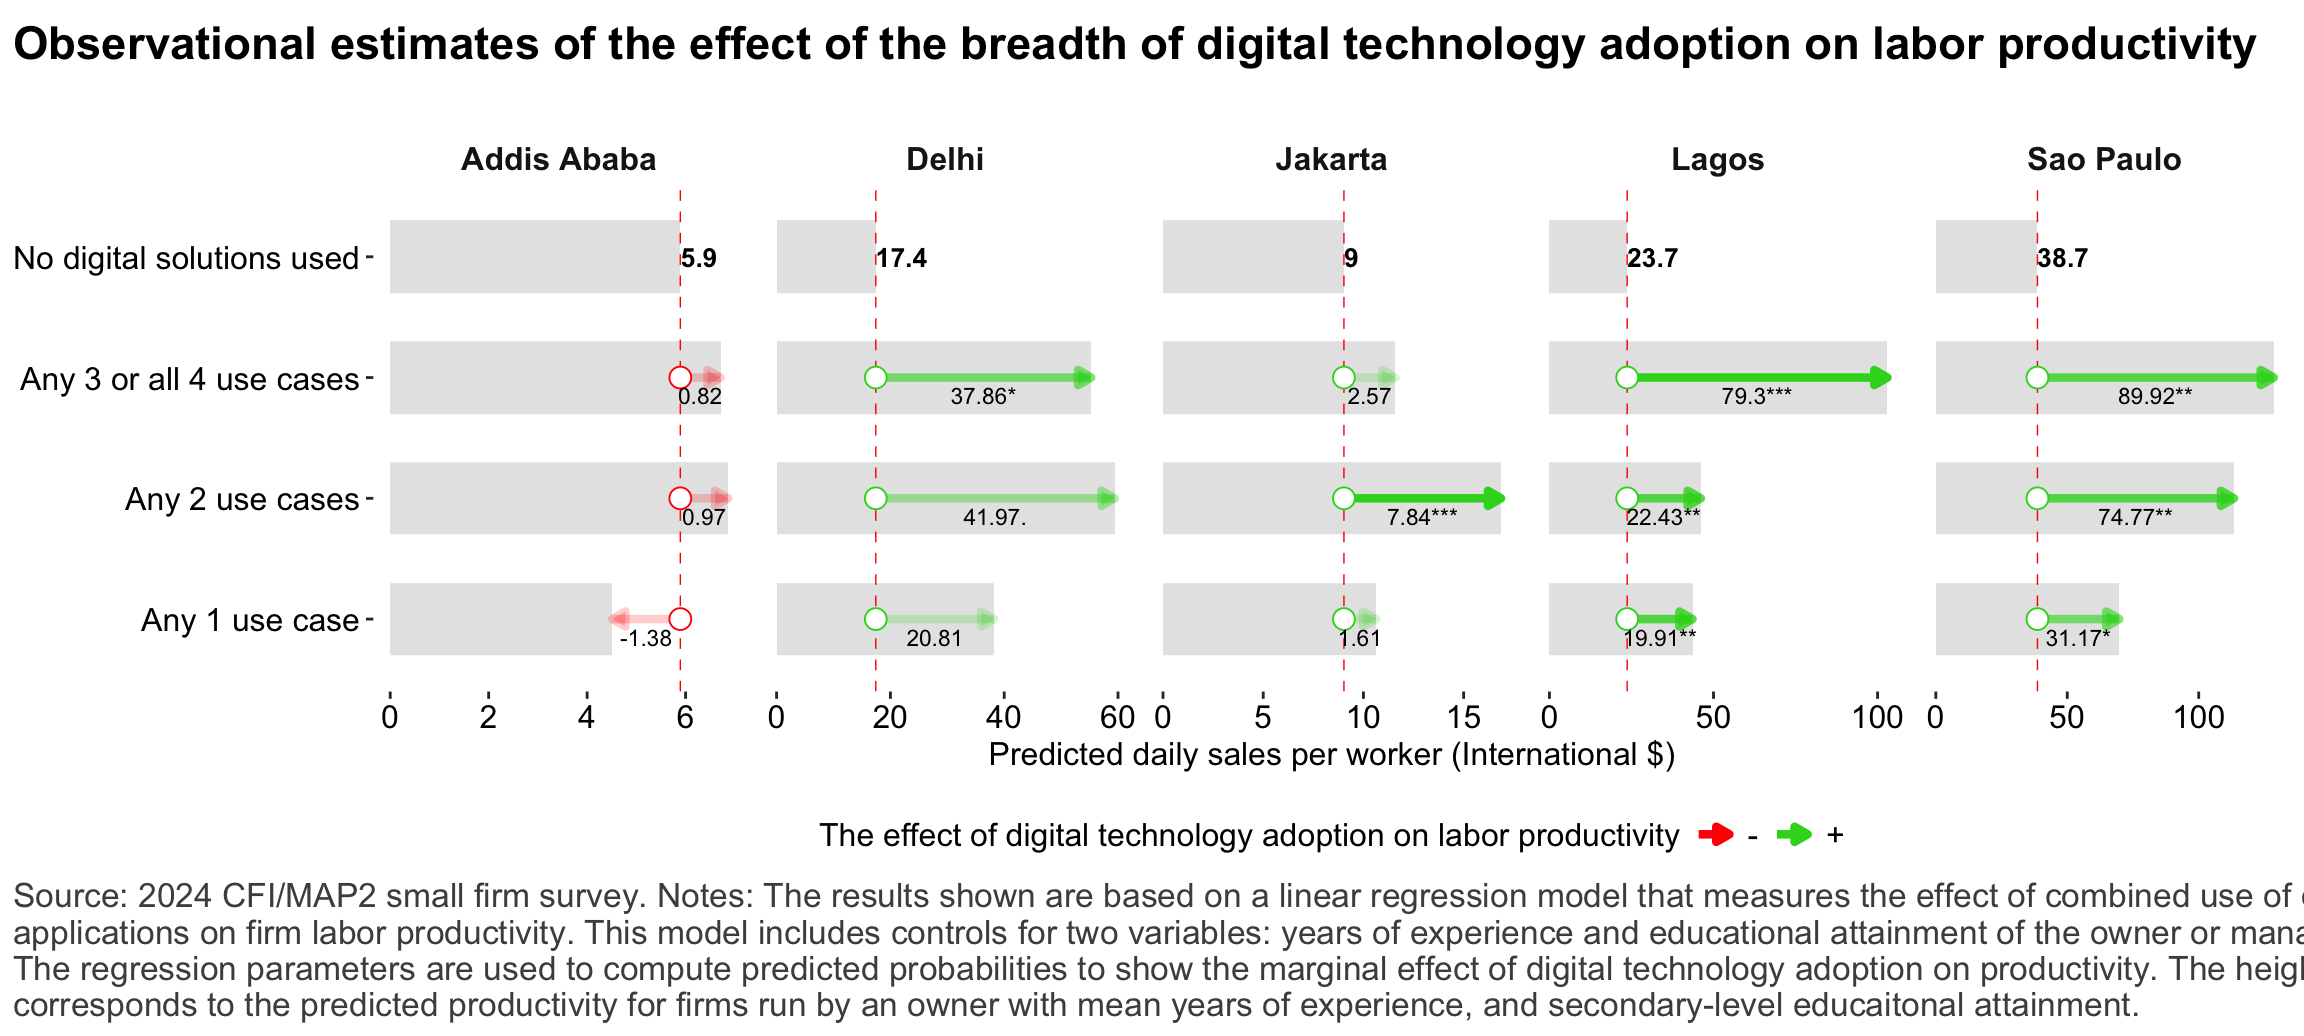
Figure 23: Relationship between depth of digital technology adoption and firm-level labor productivity
Financial services
Figure 24: Summary measures of financial access
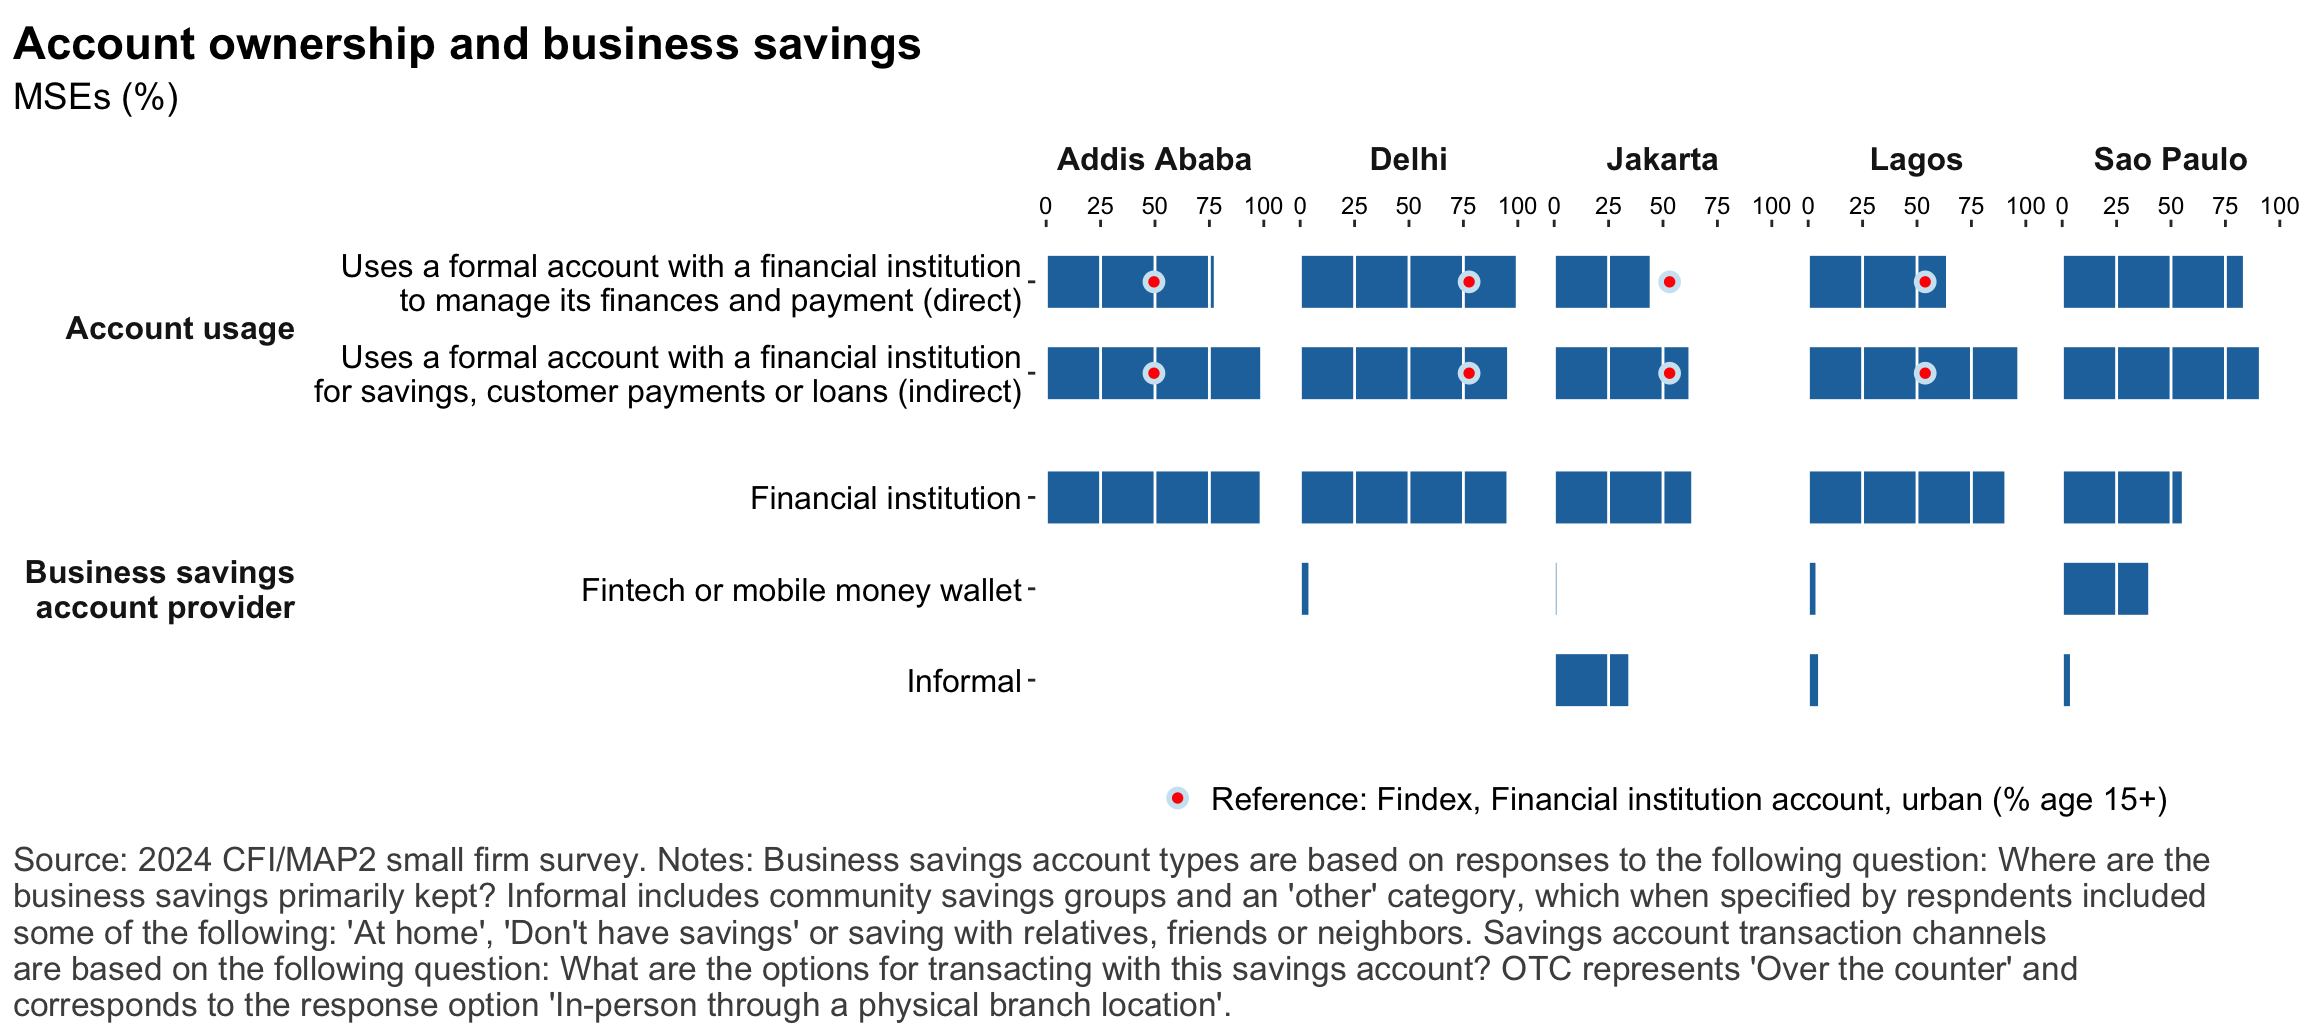
Figure 25: Financical accounts and savings
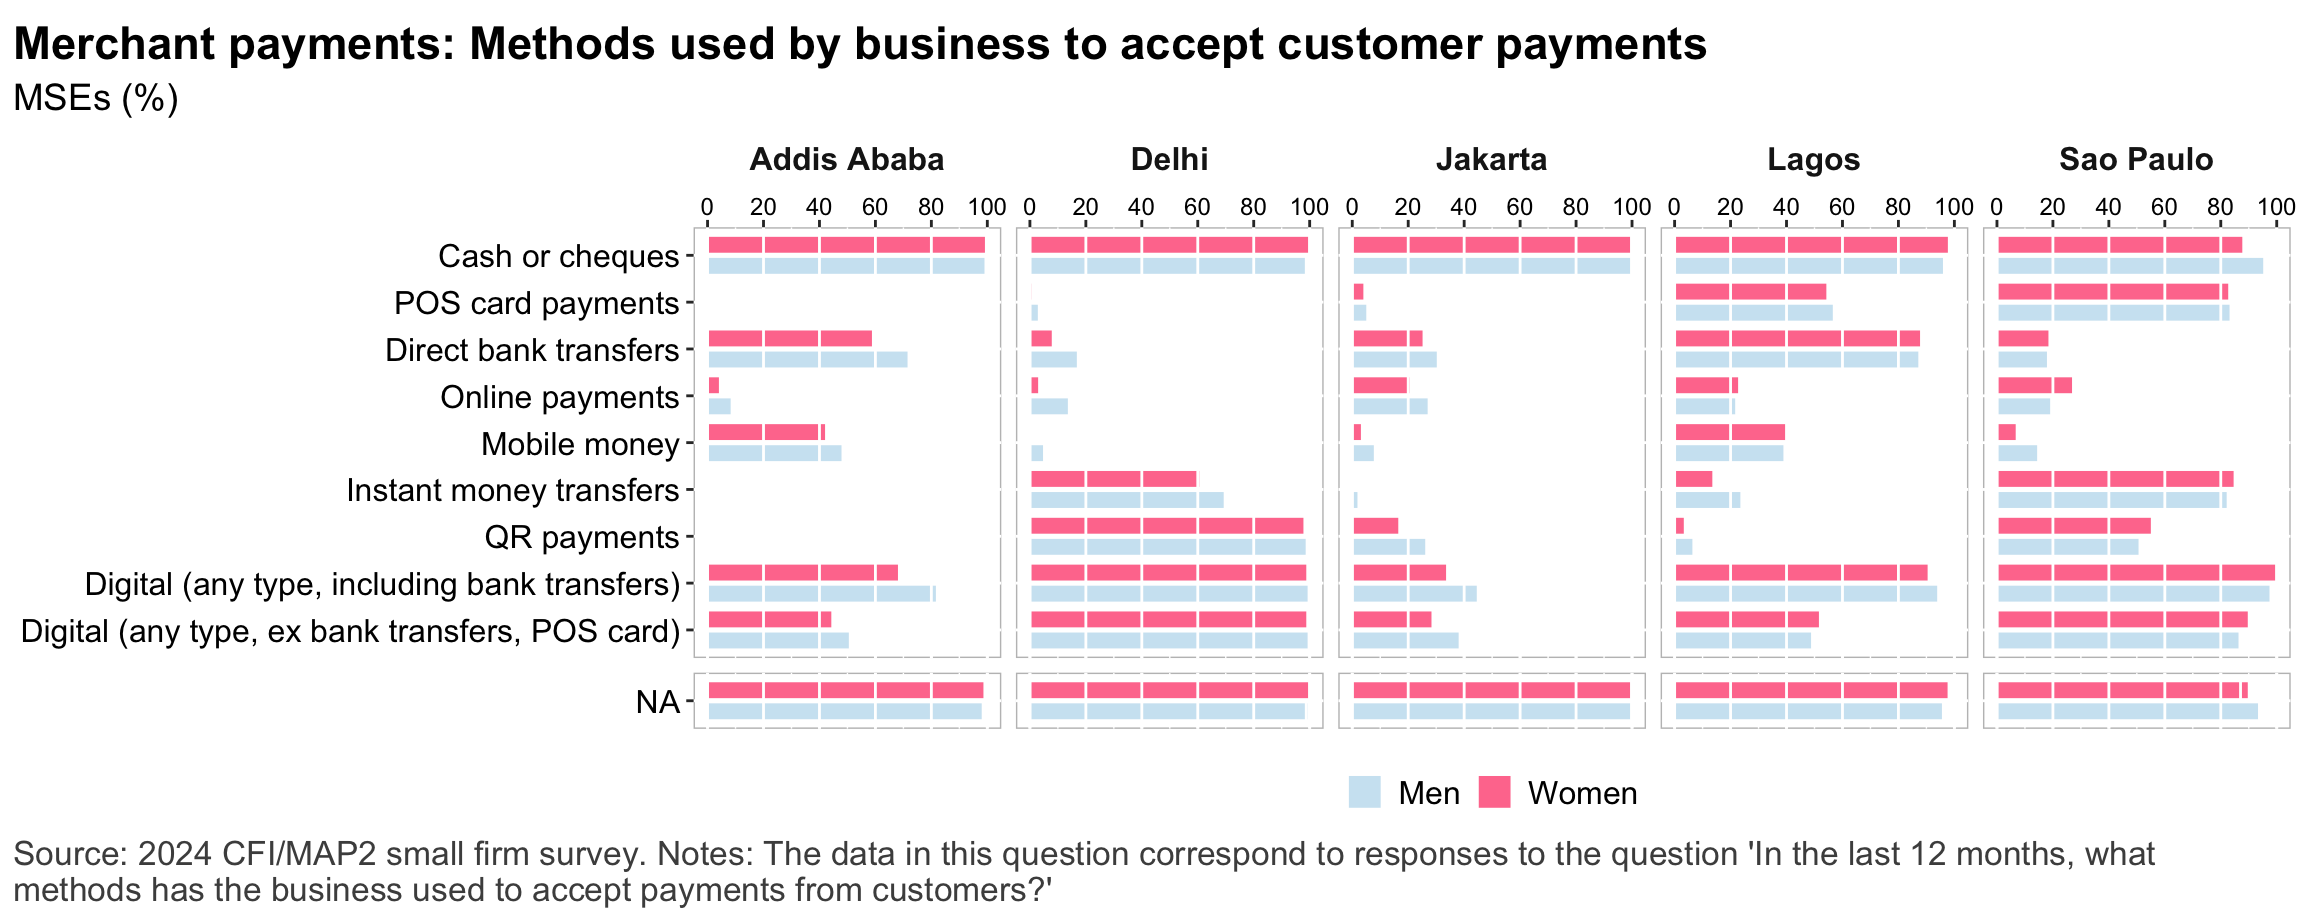
Figure 26: Merchant payments
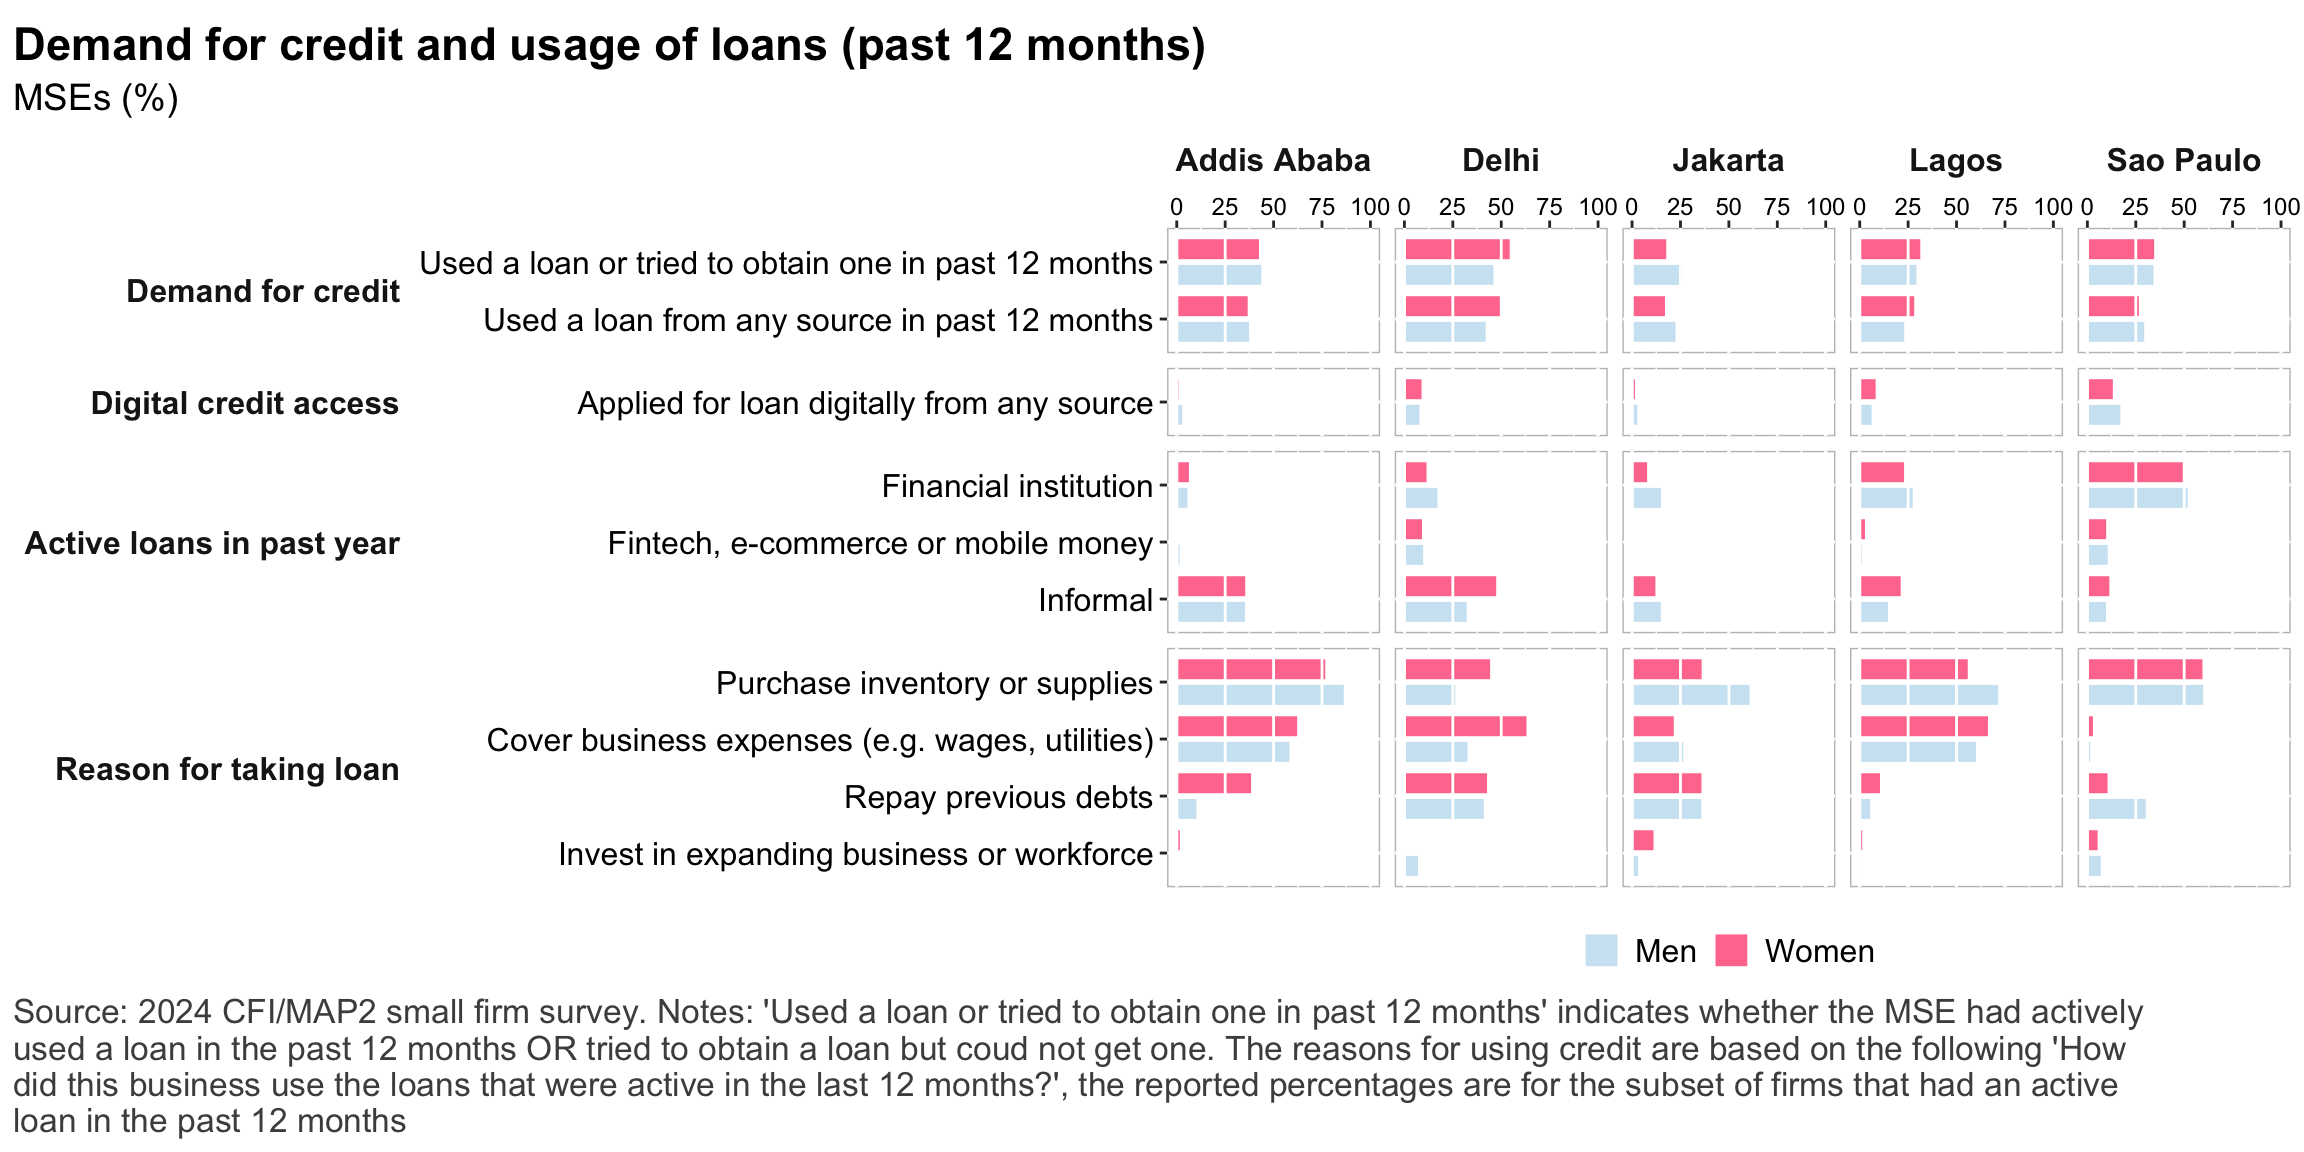
Figure 27: Demand for credit
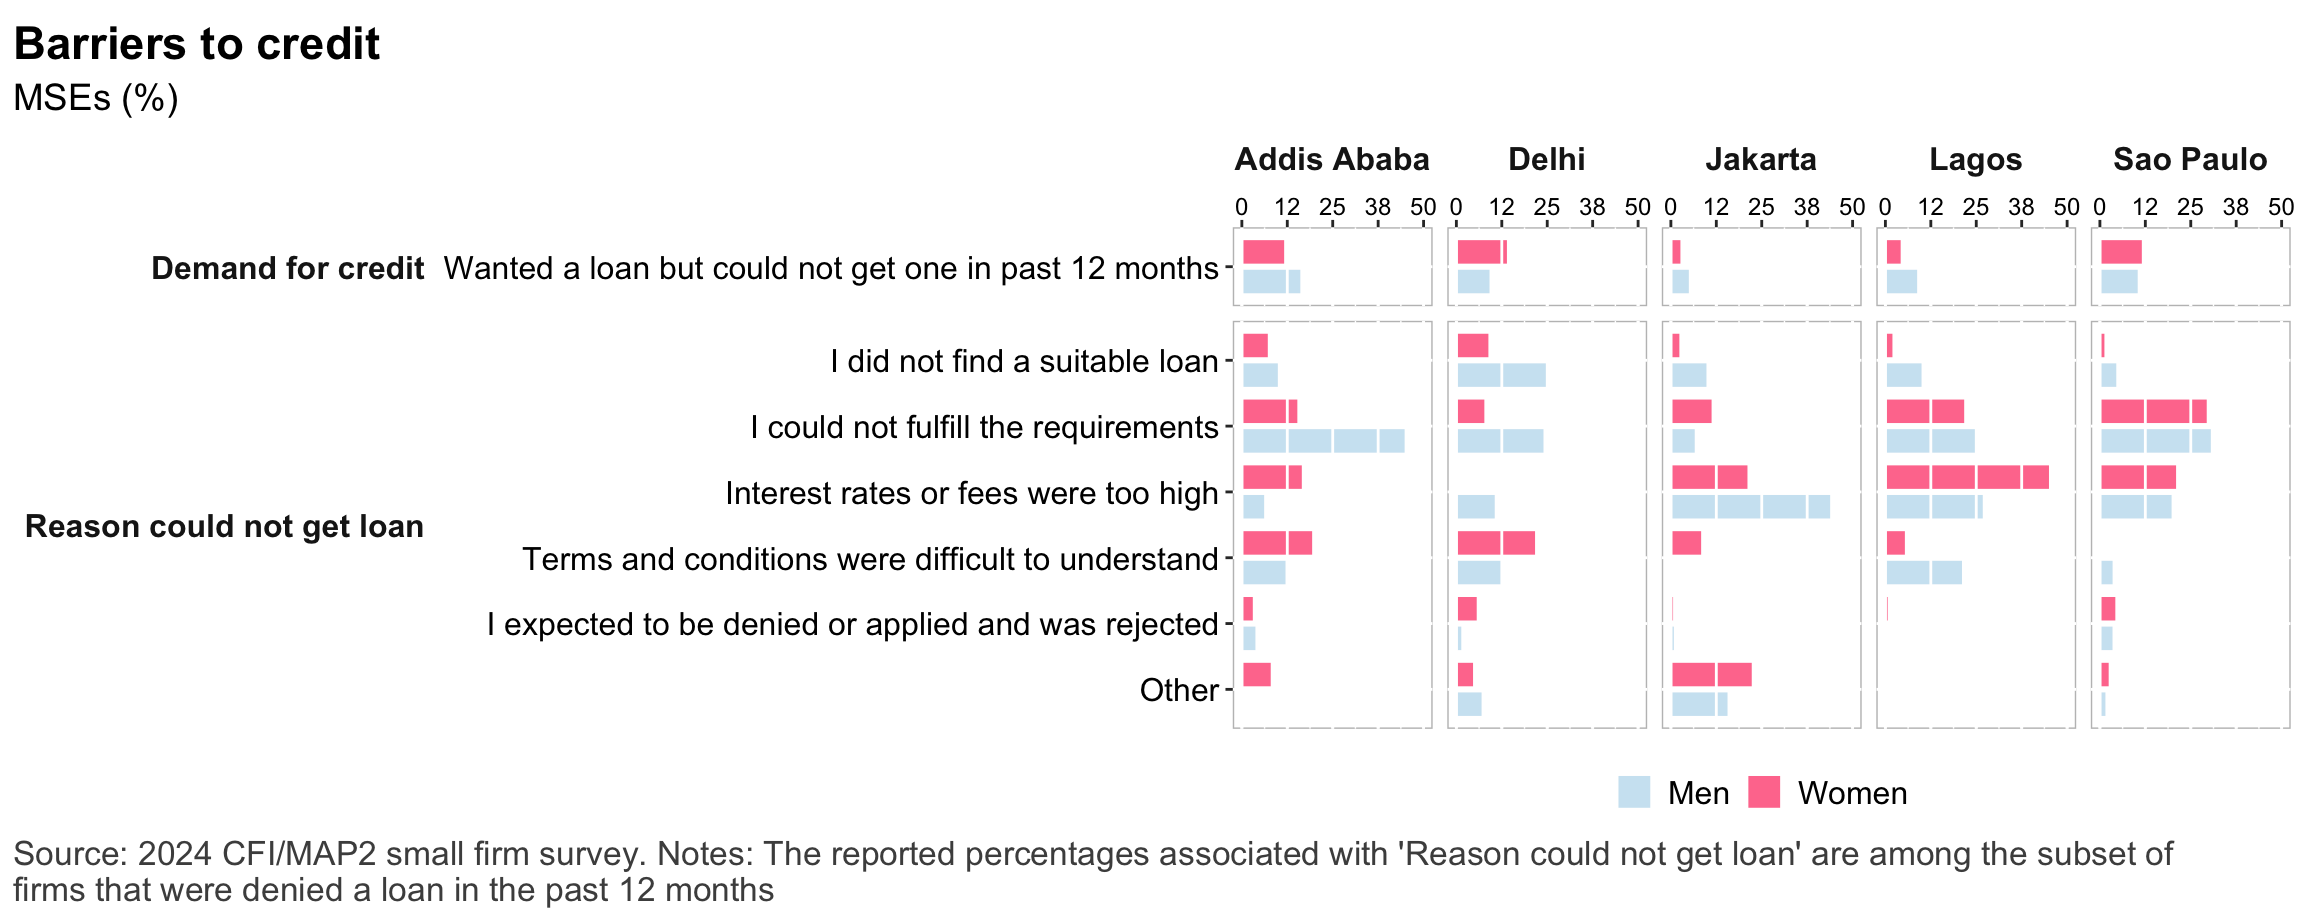
Figure 28: Barriers to credit
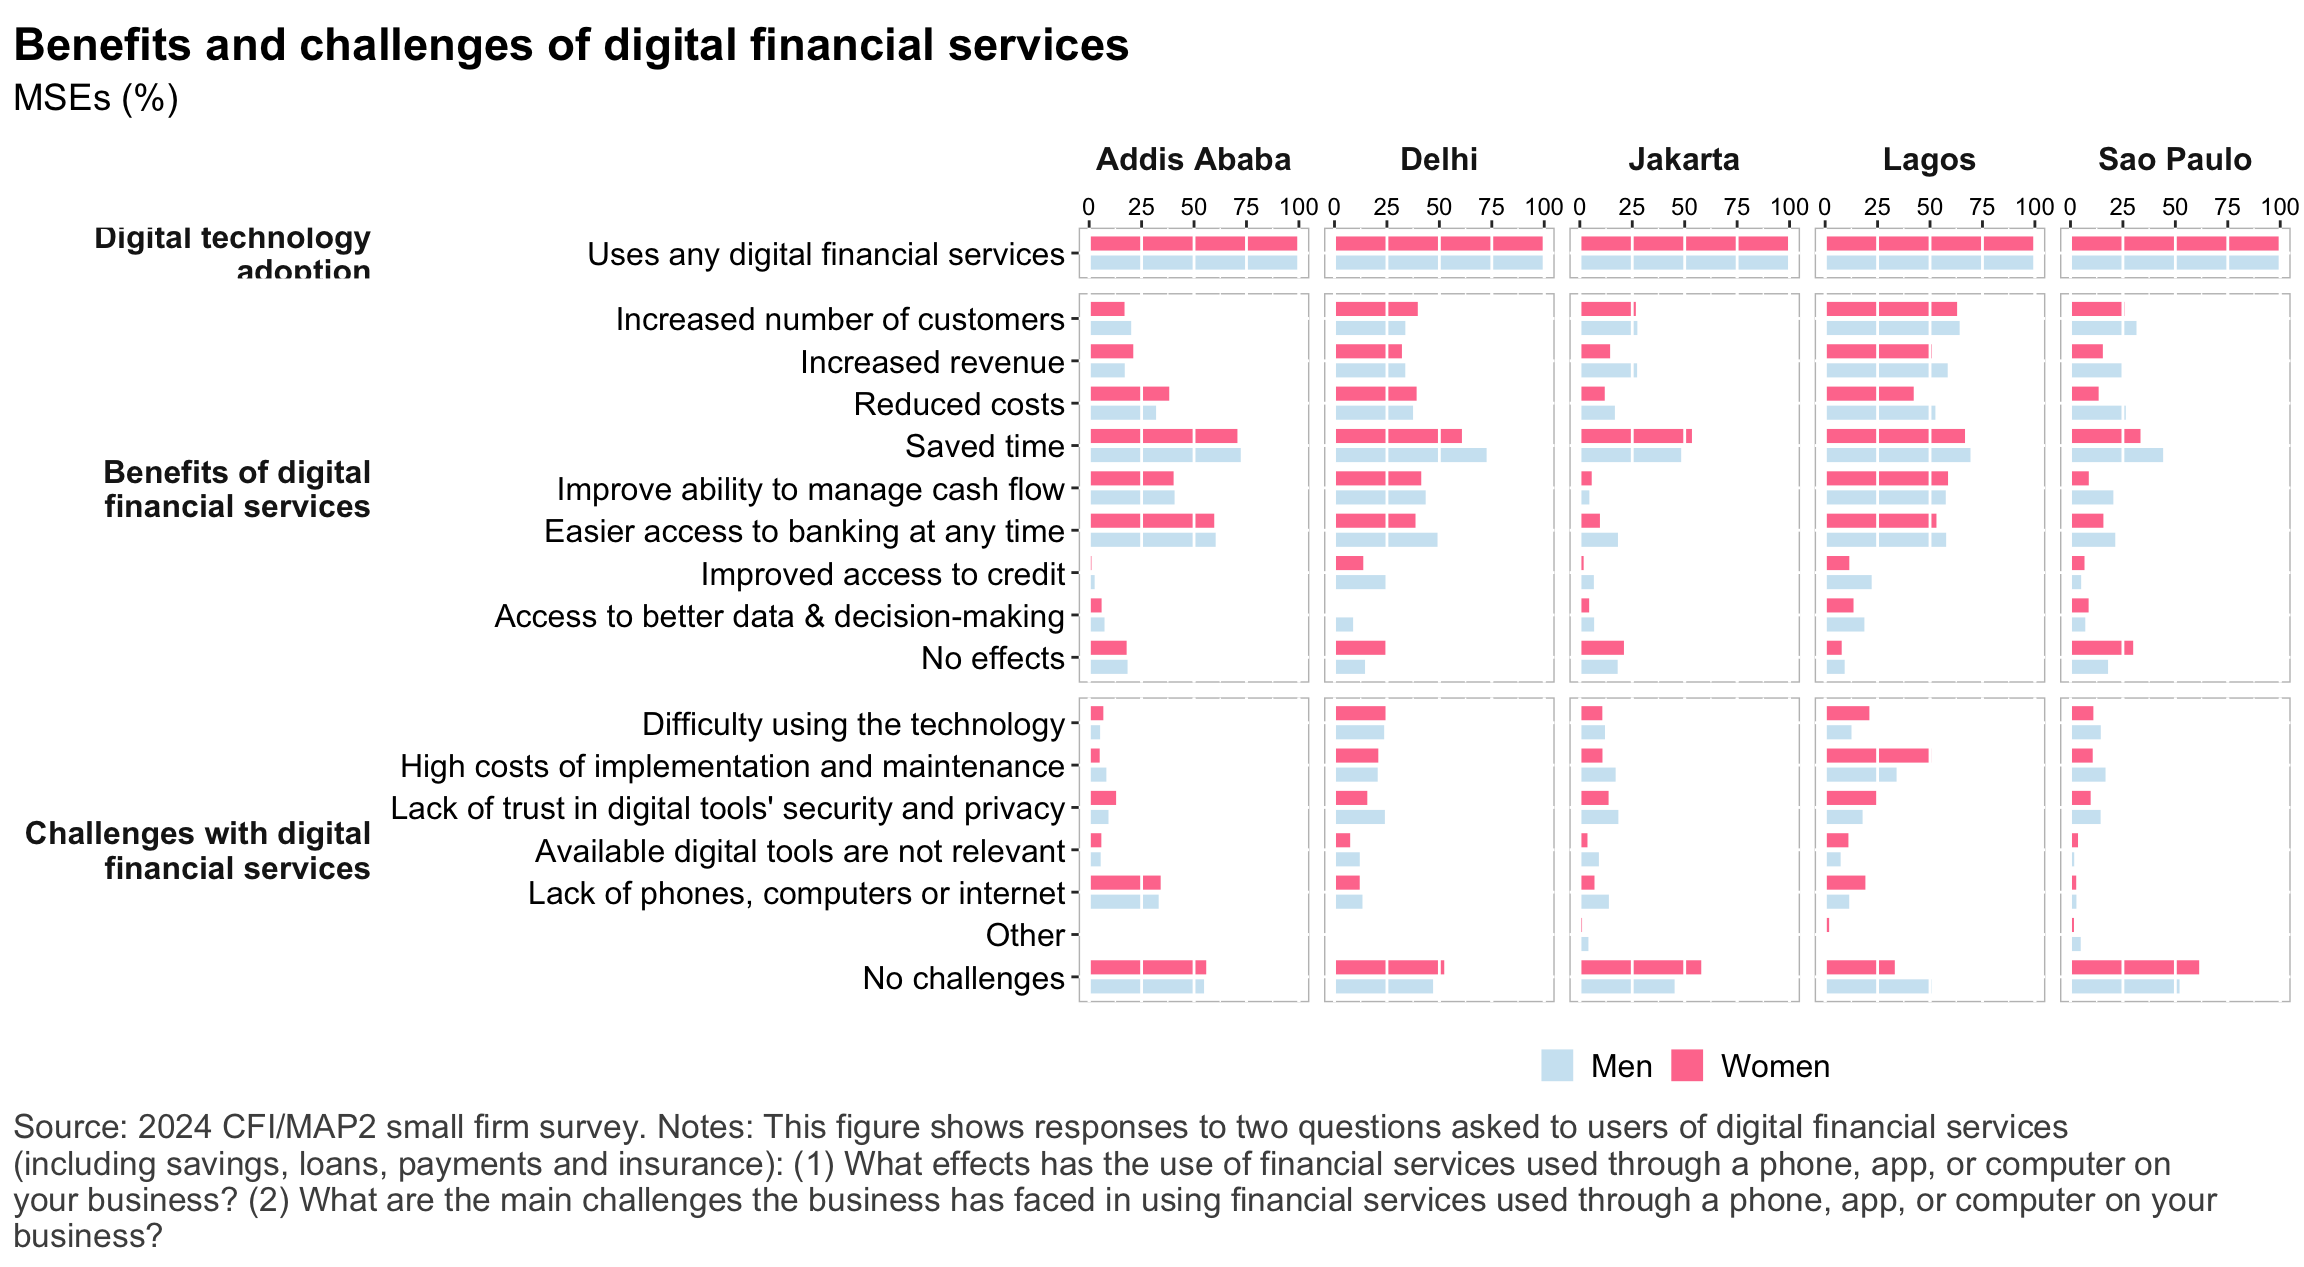
Figure 29: Impacts of digital financial services
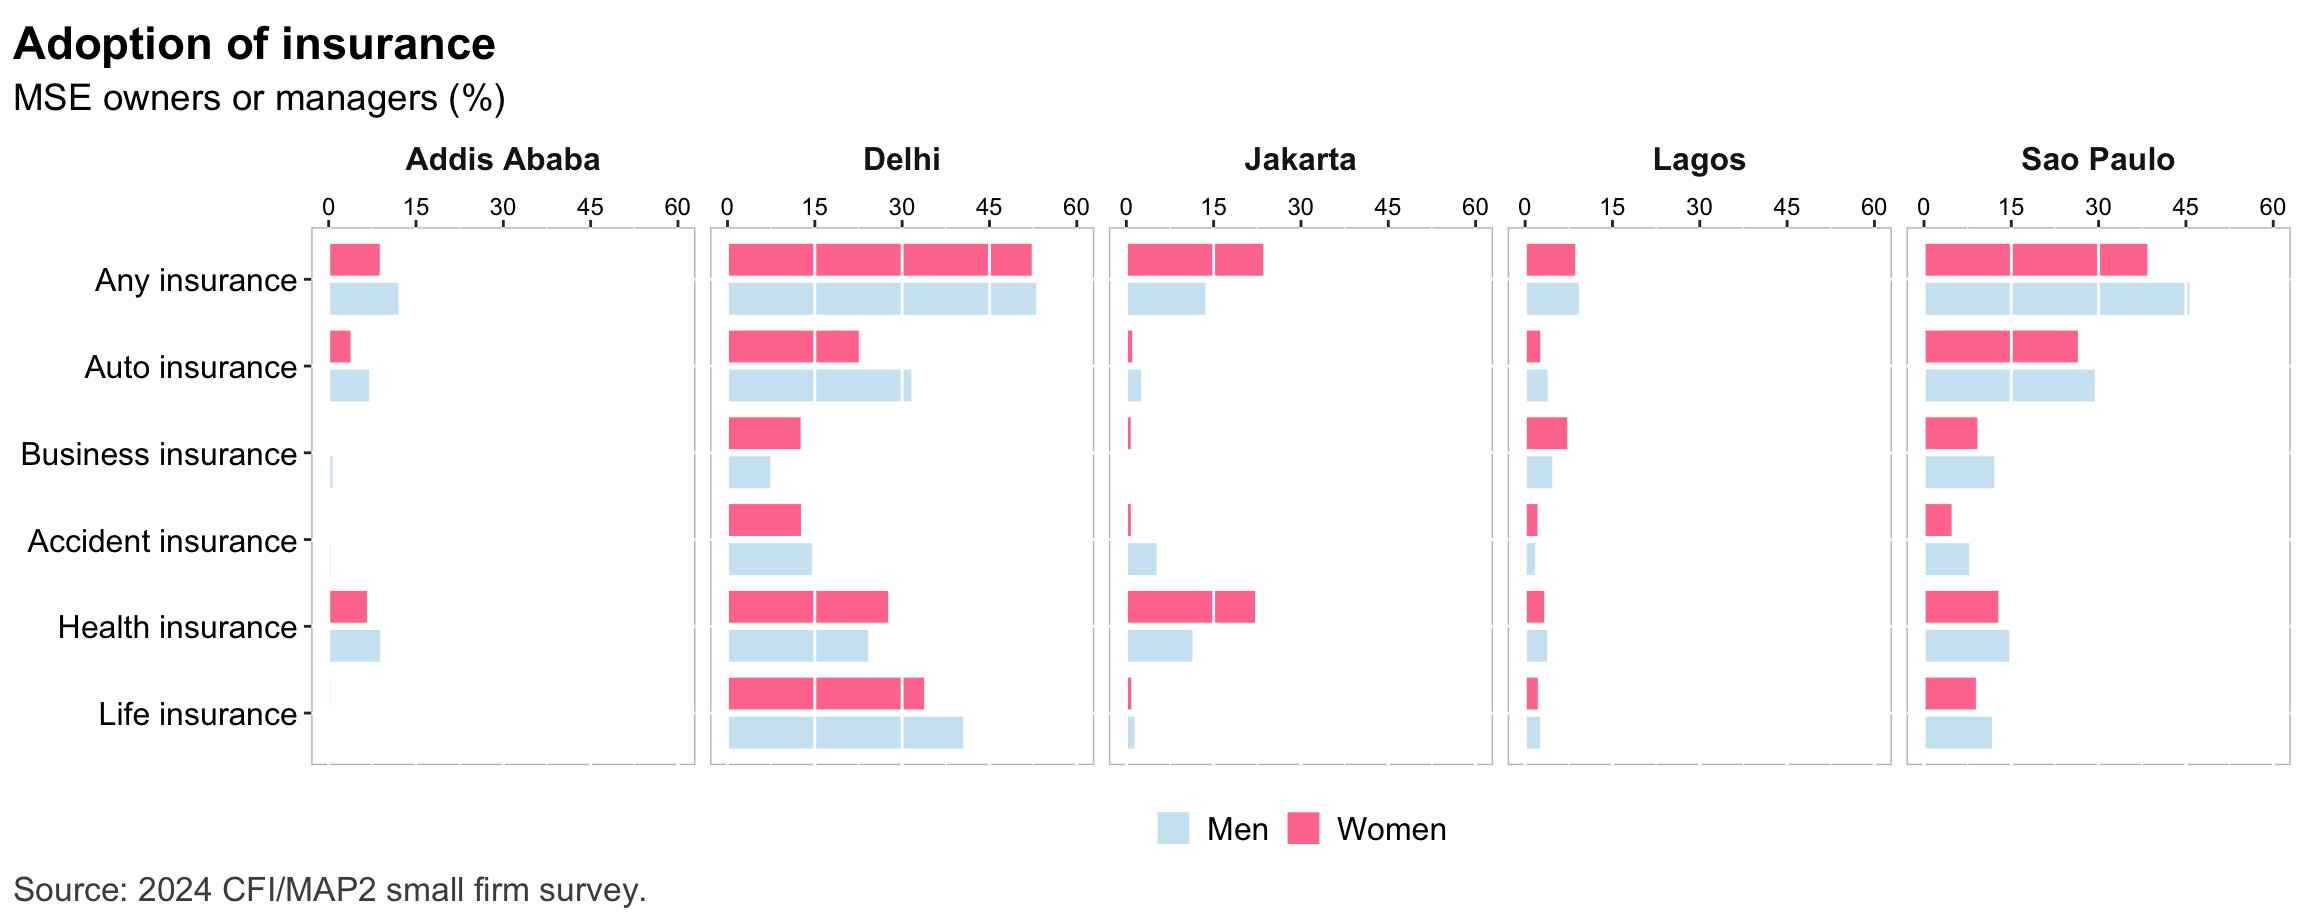
Figure 30: Insurance usage
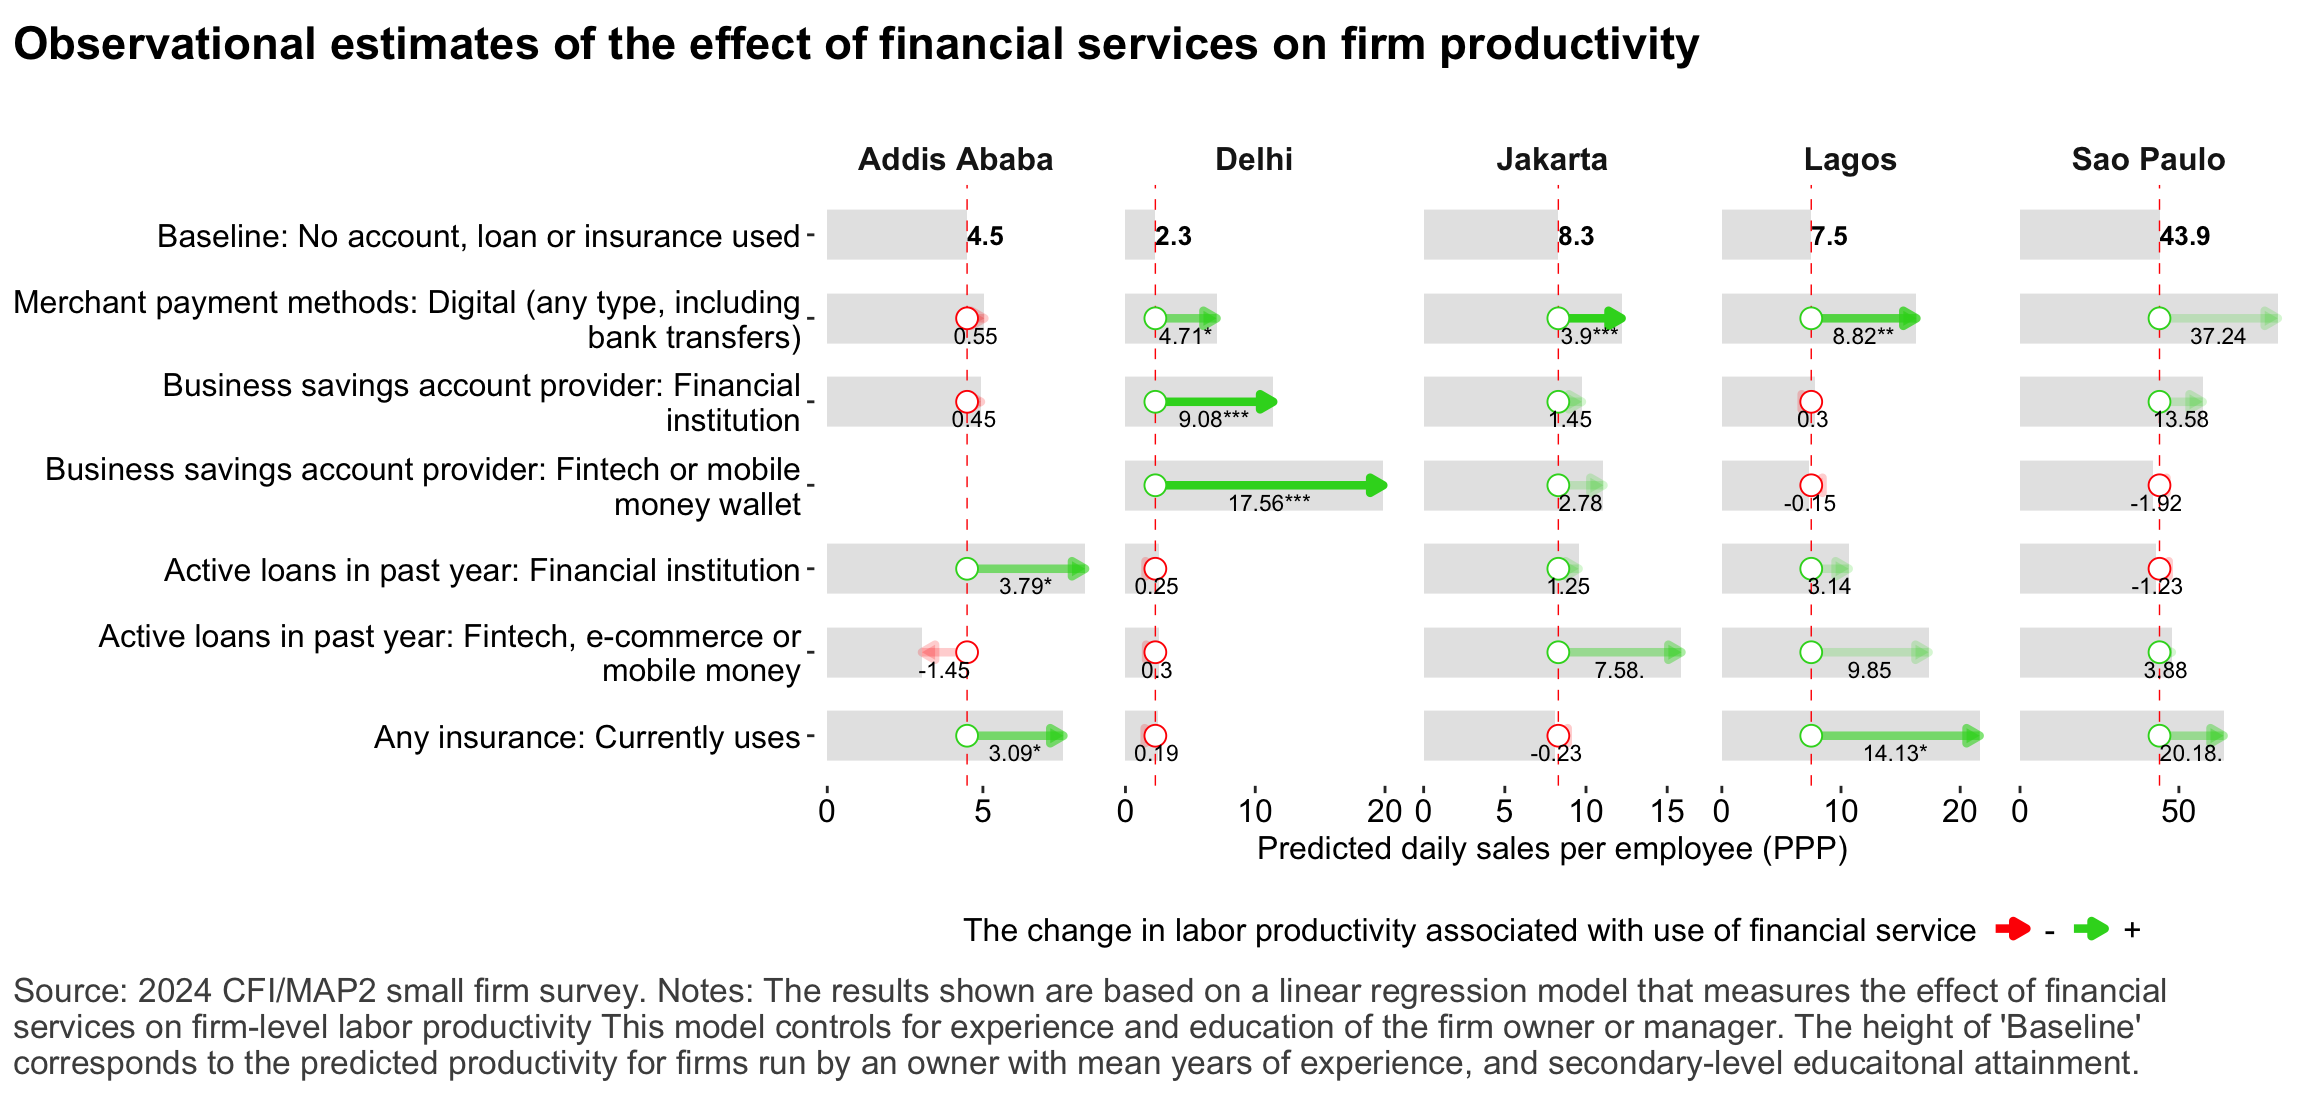
Figure 31: Relationship between financial services and firm-level labor productivity
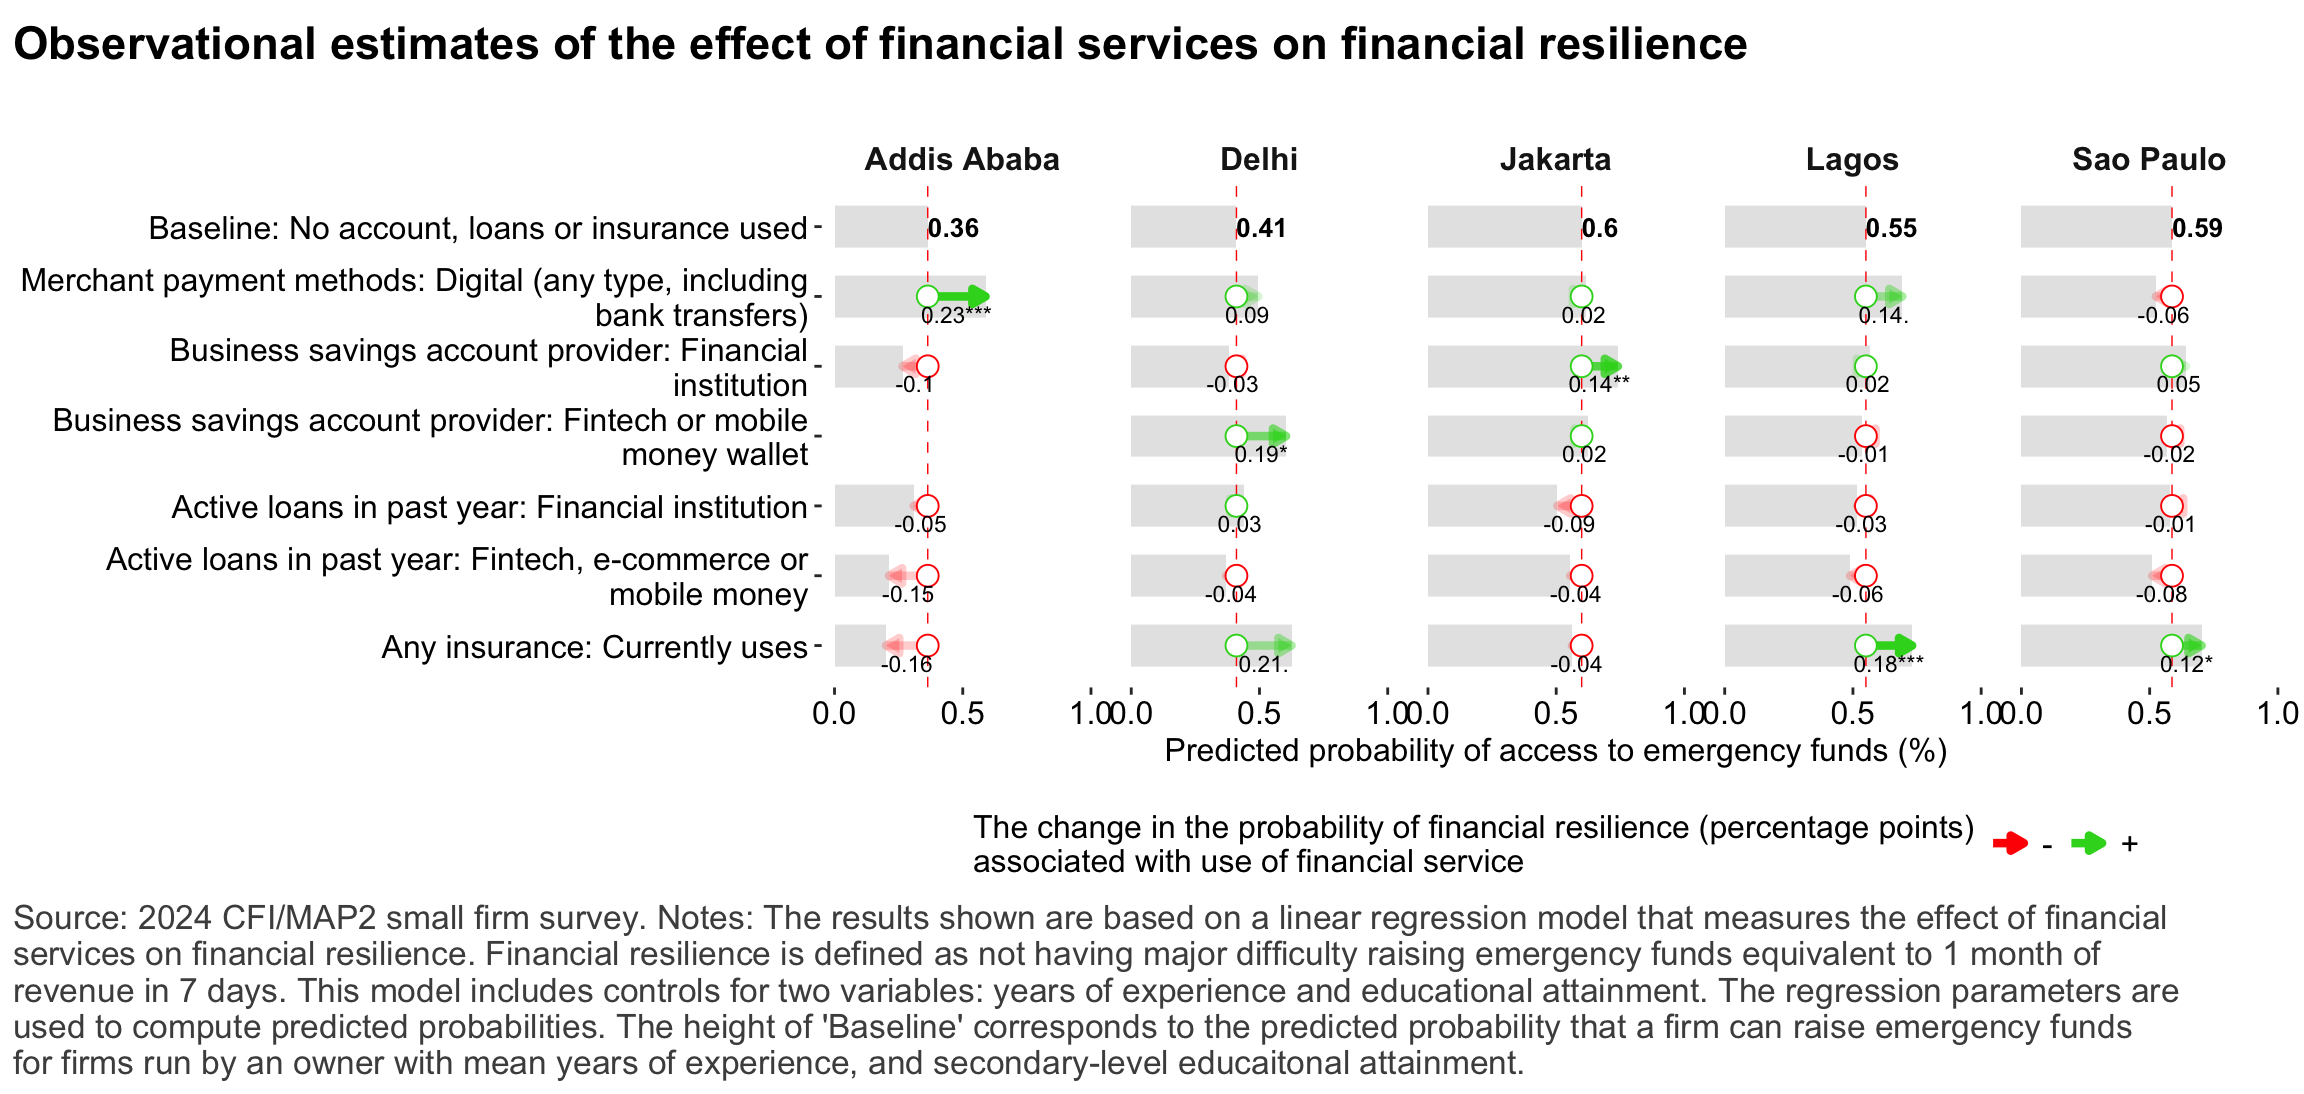
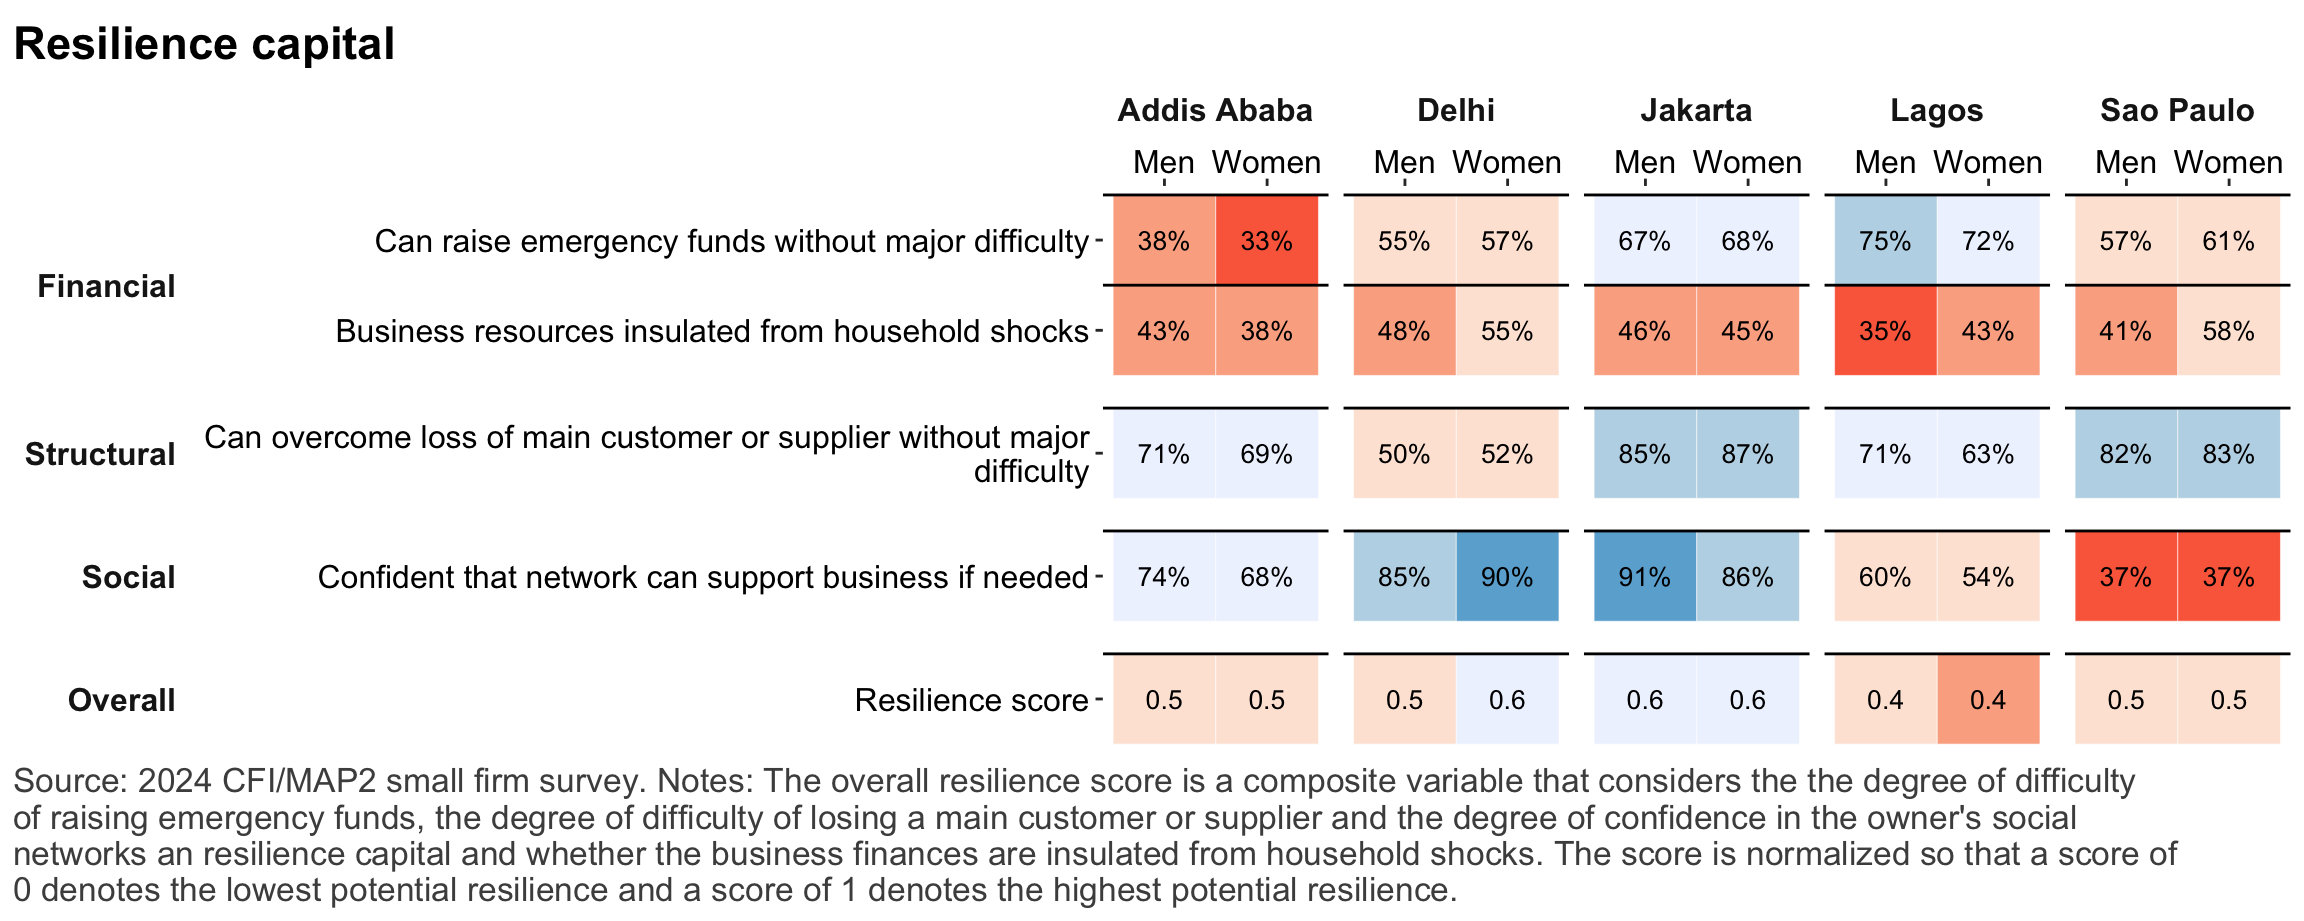
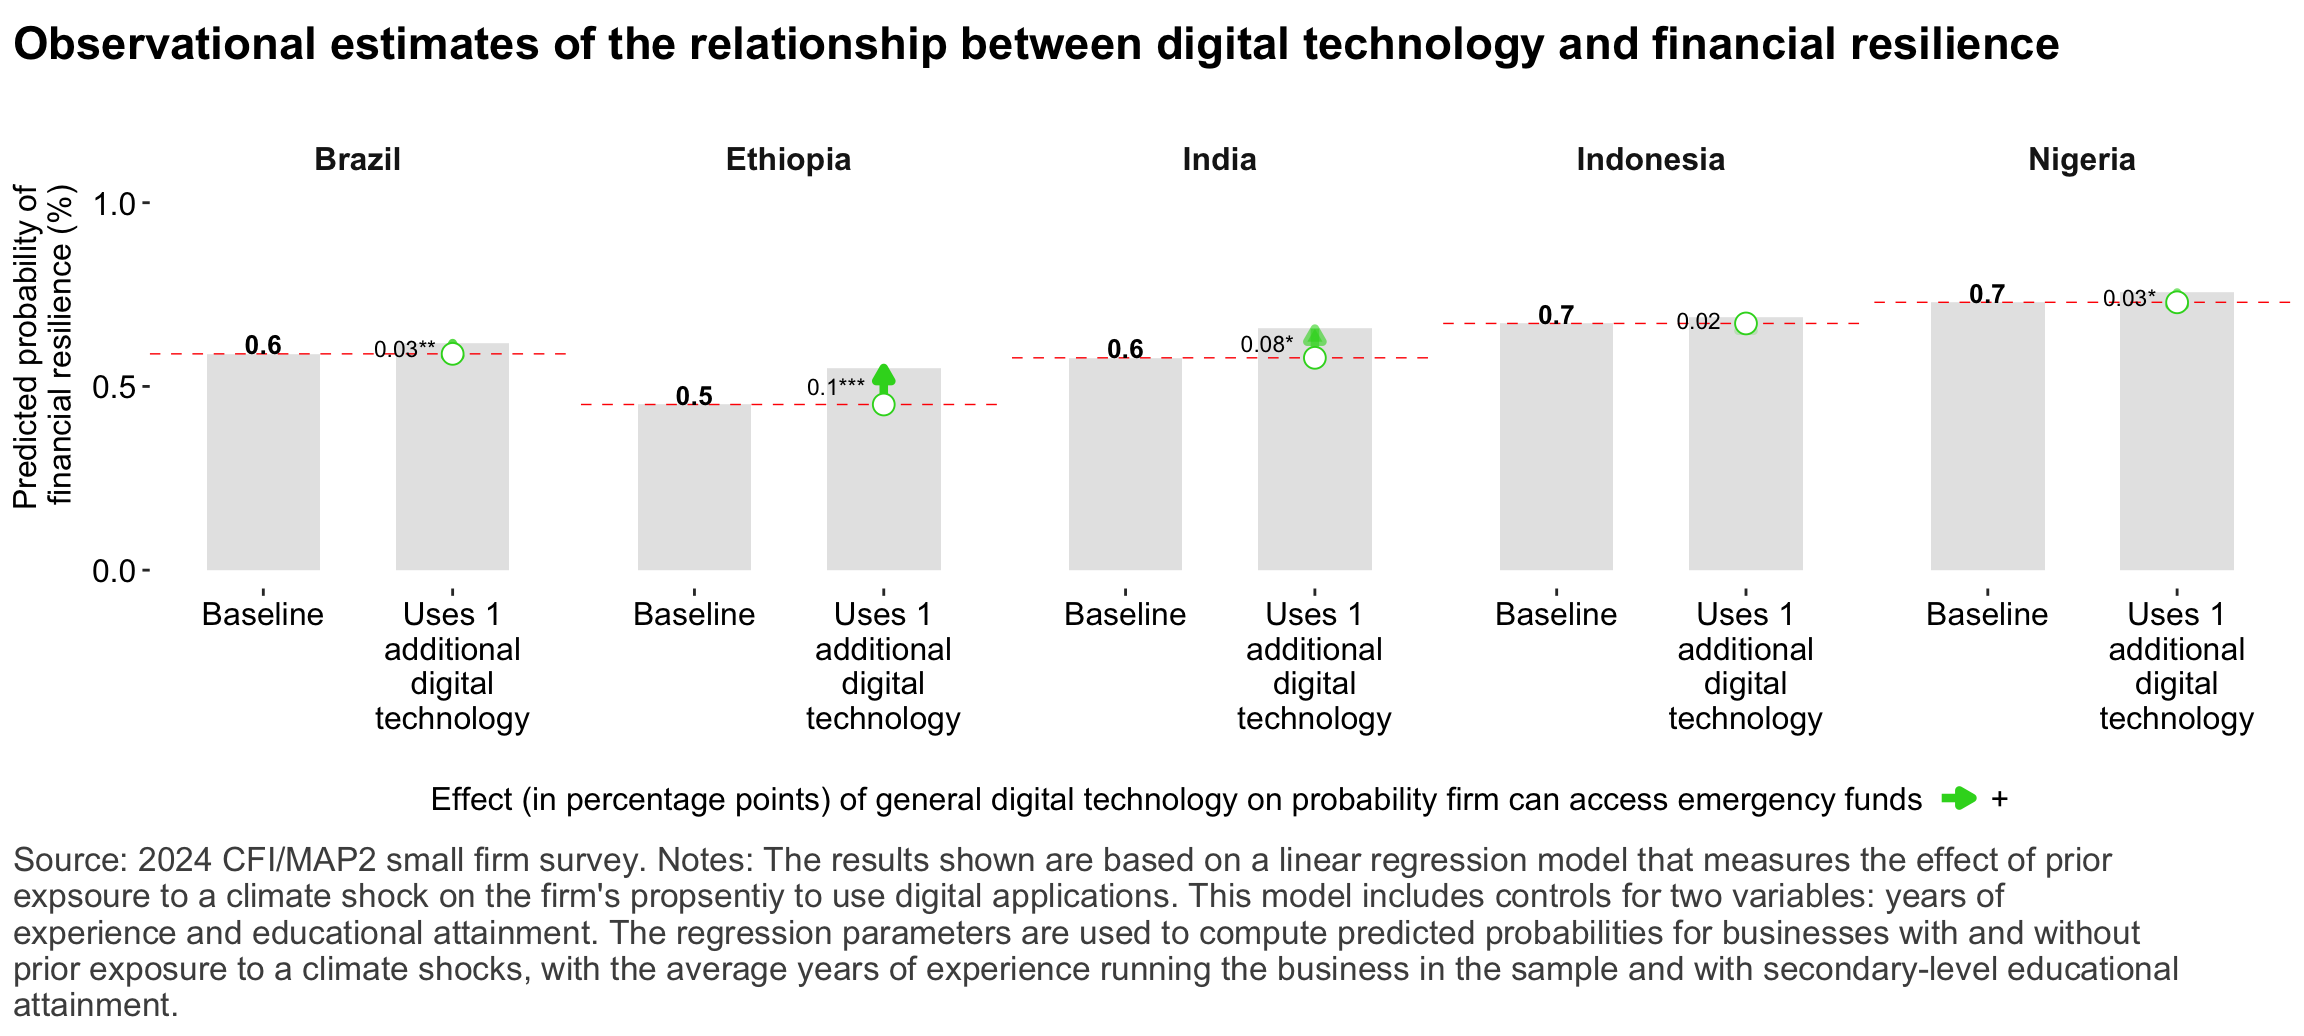
Figure 32: Relationship between financial services and financial resilience
Figure 33: Relationship between financial services and firm growth
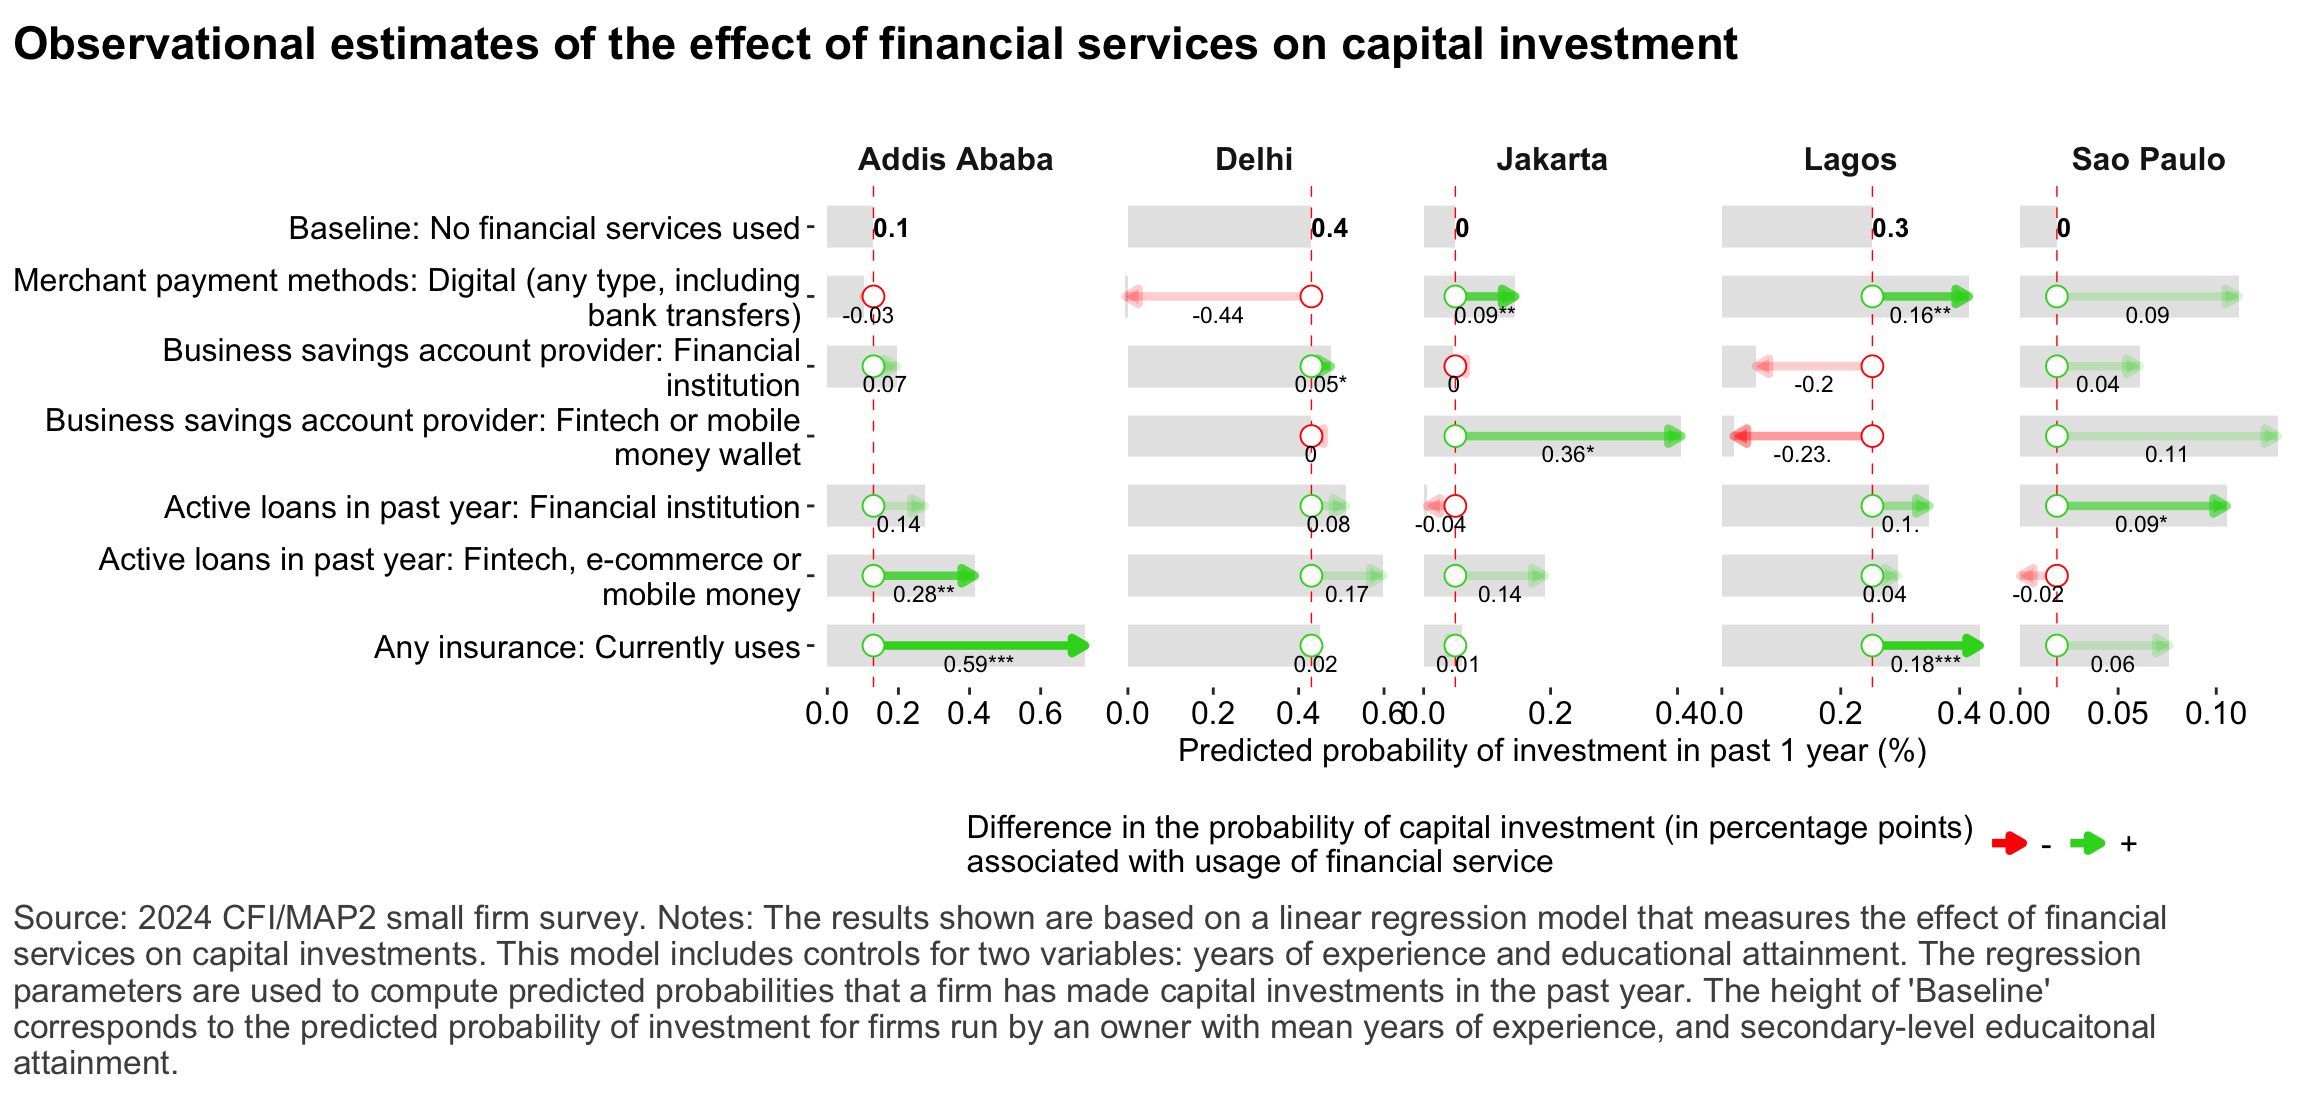
Figure 34: Relationship between financial services and capital investment
Consumer protection
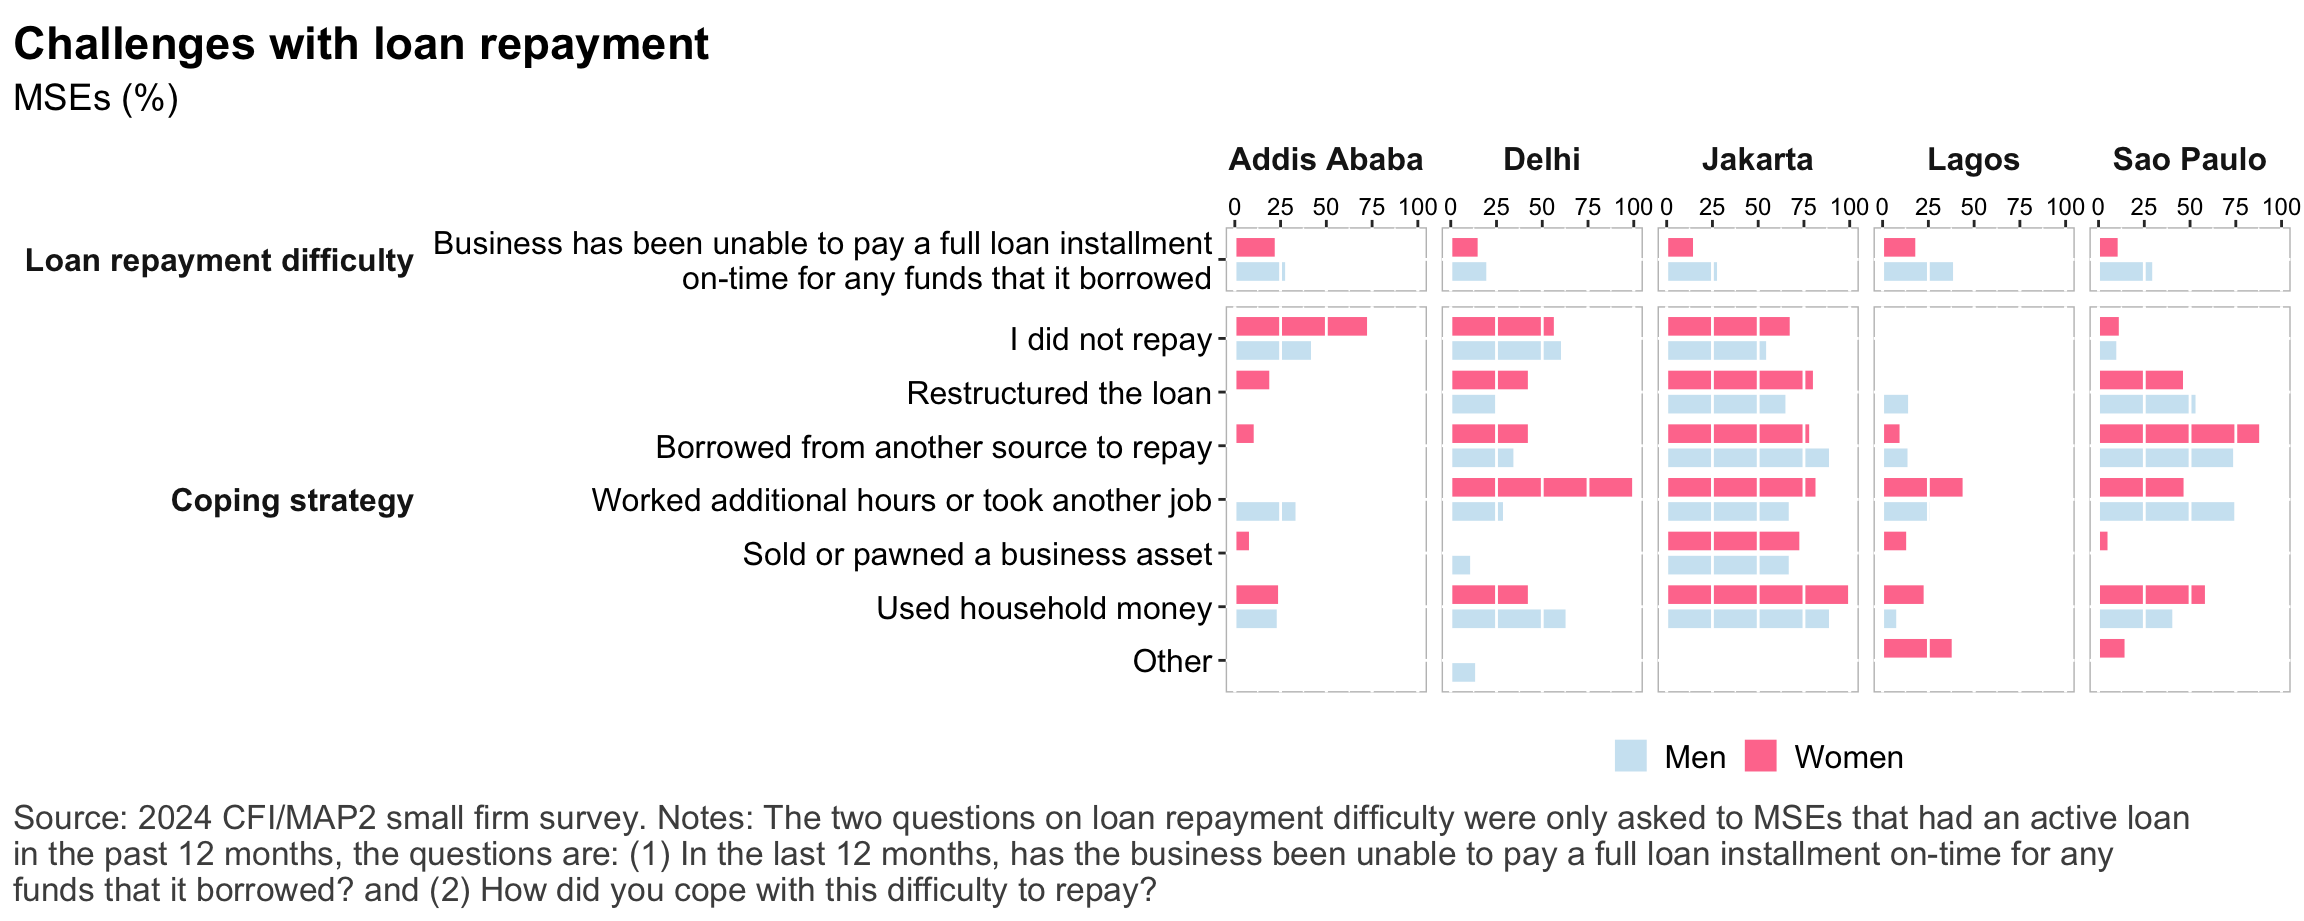
Figure 35: Challenges with loan repayment
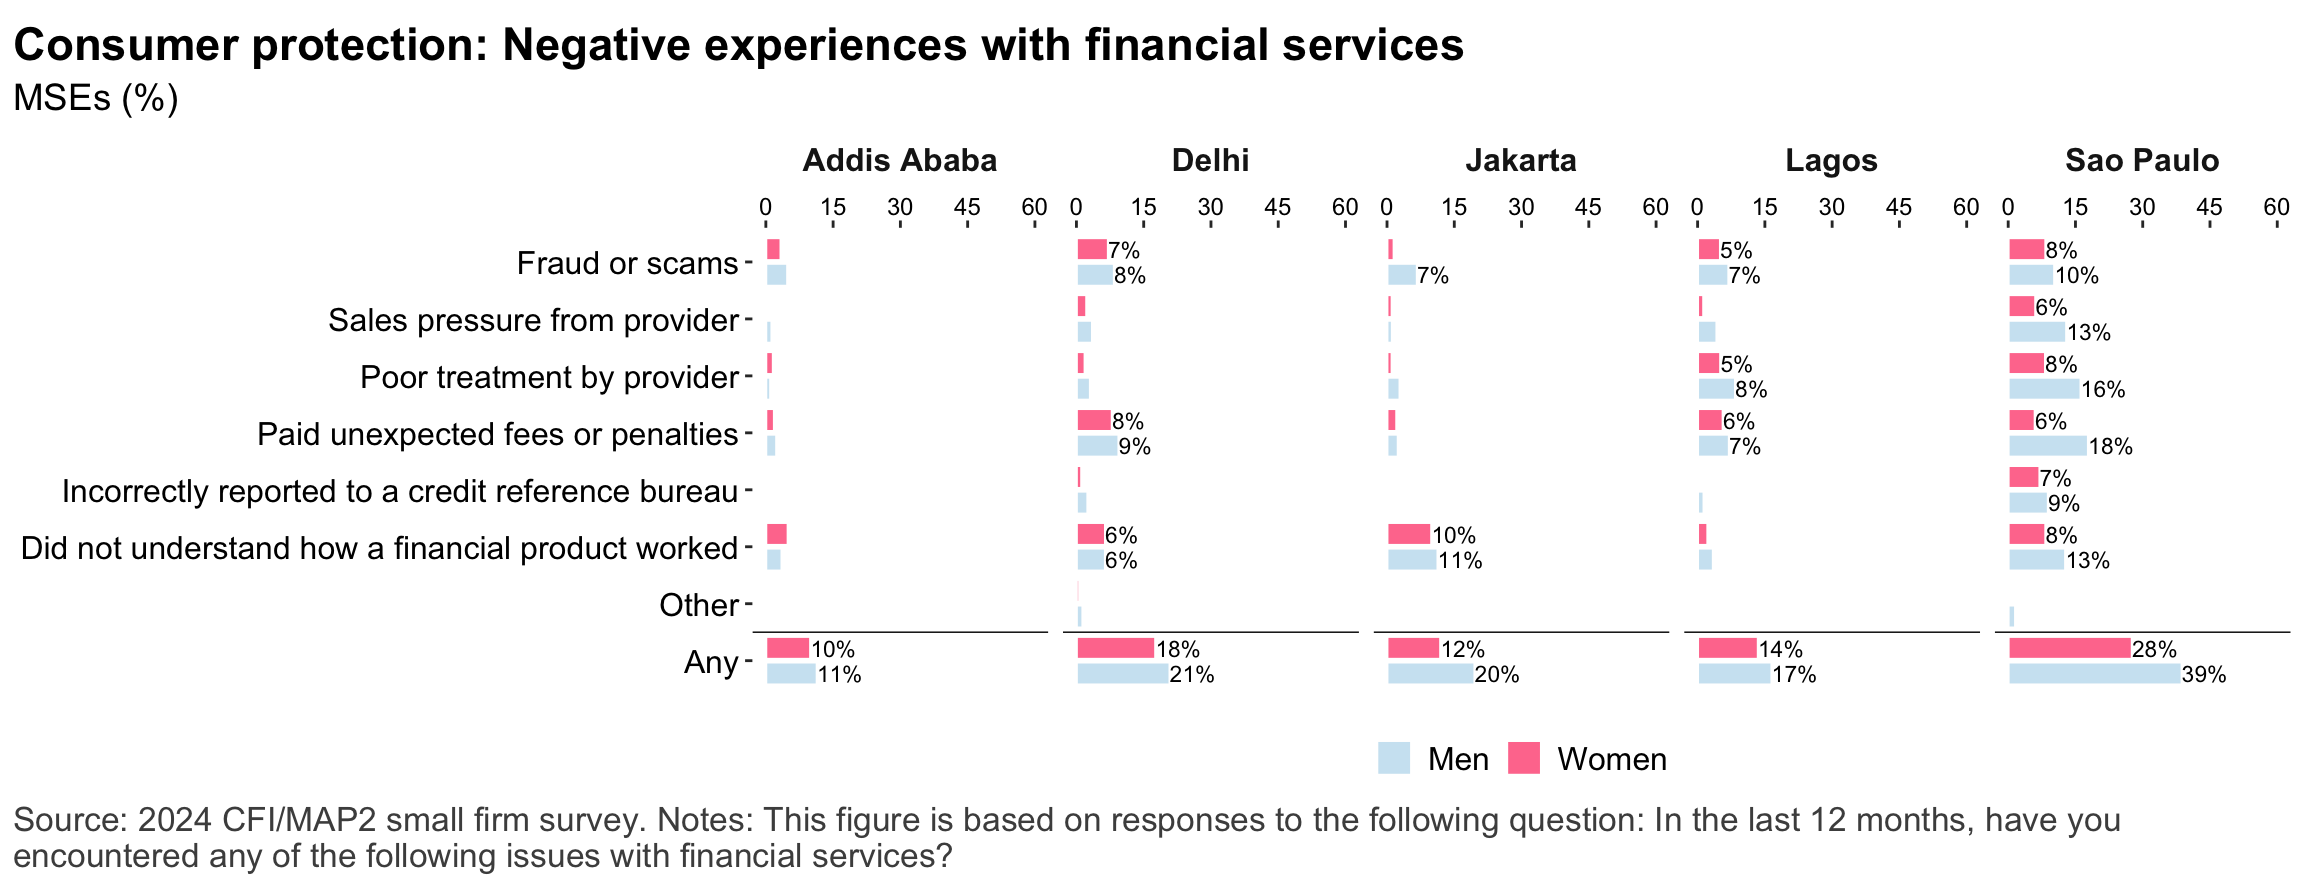
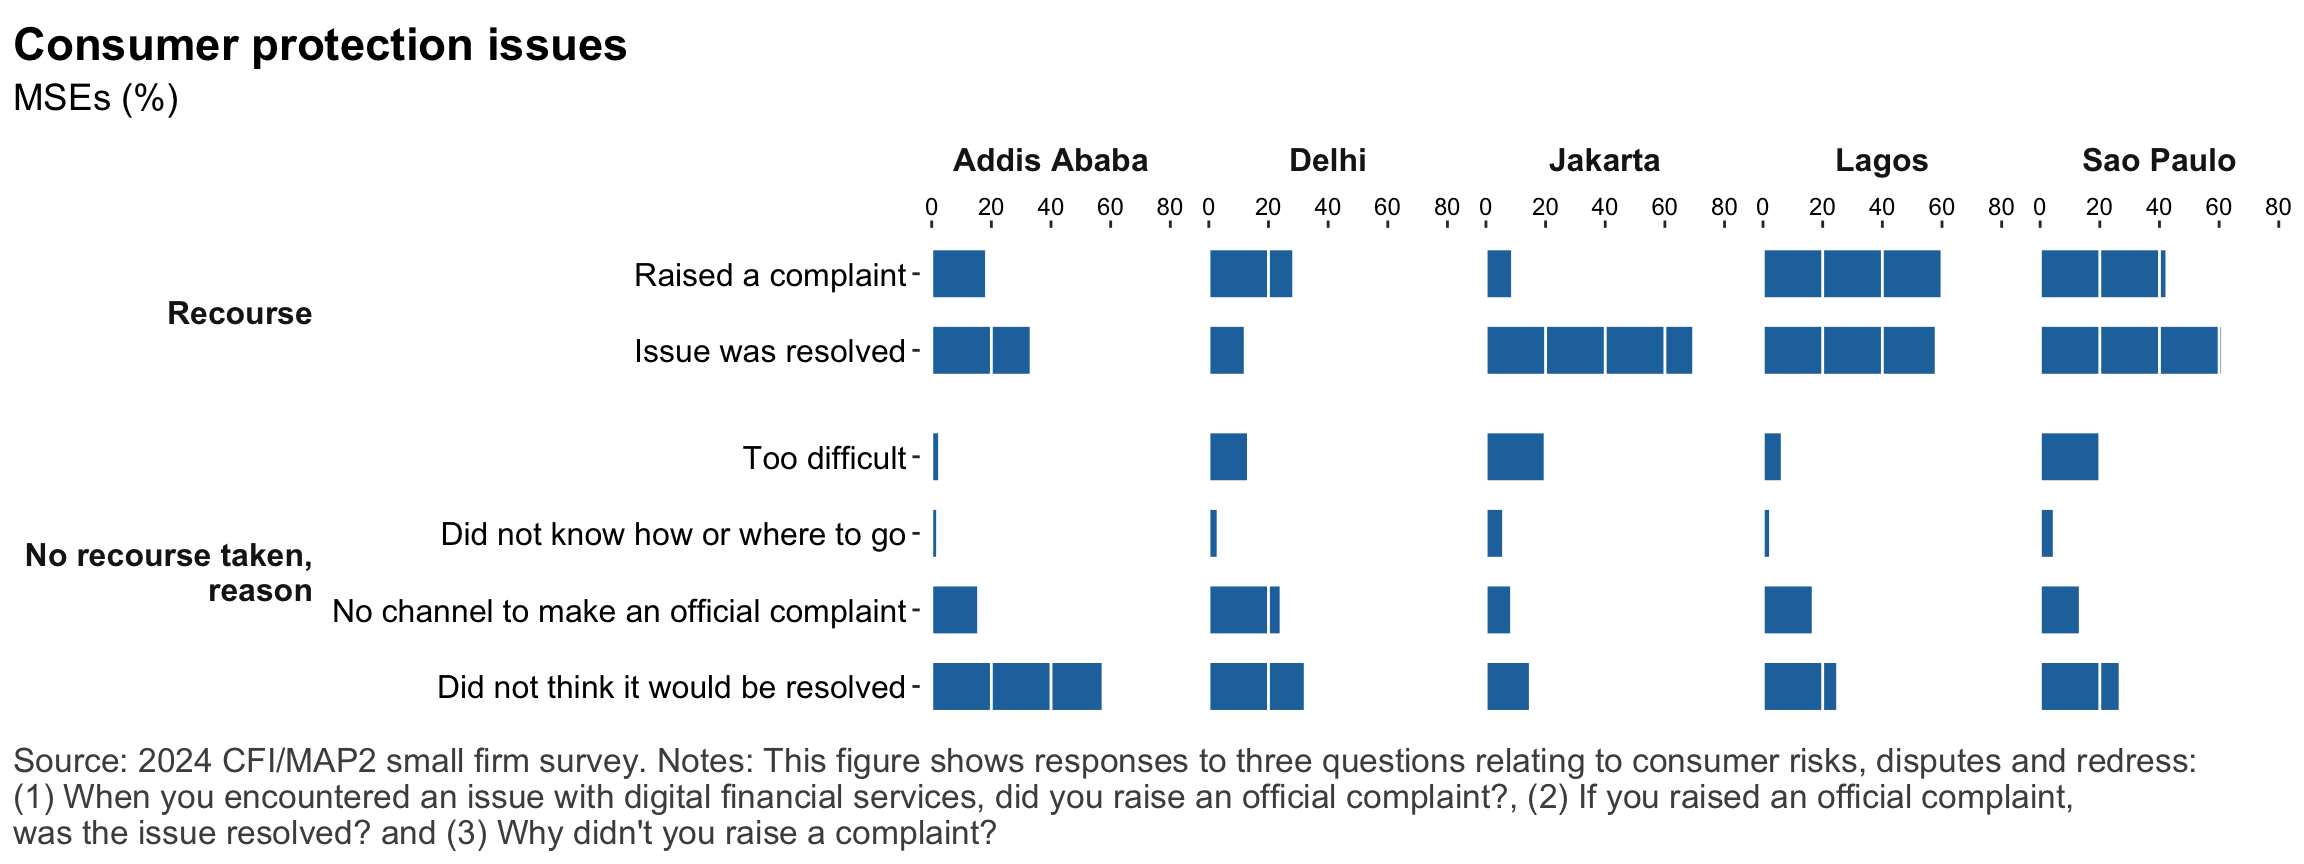
Figure 36: Consumer protection issues
Figure 37: Consumer protection issues
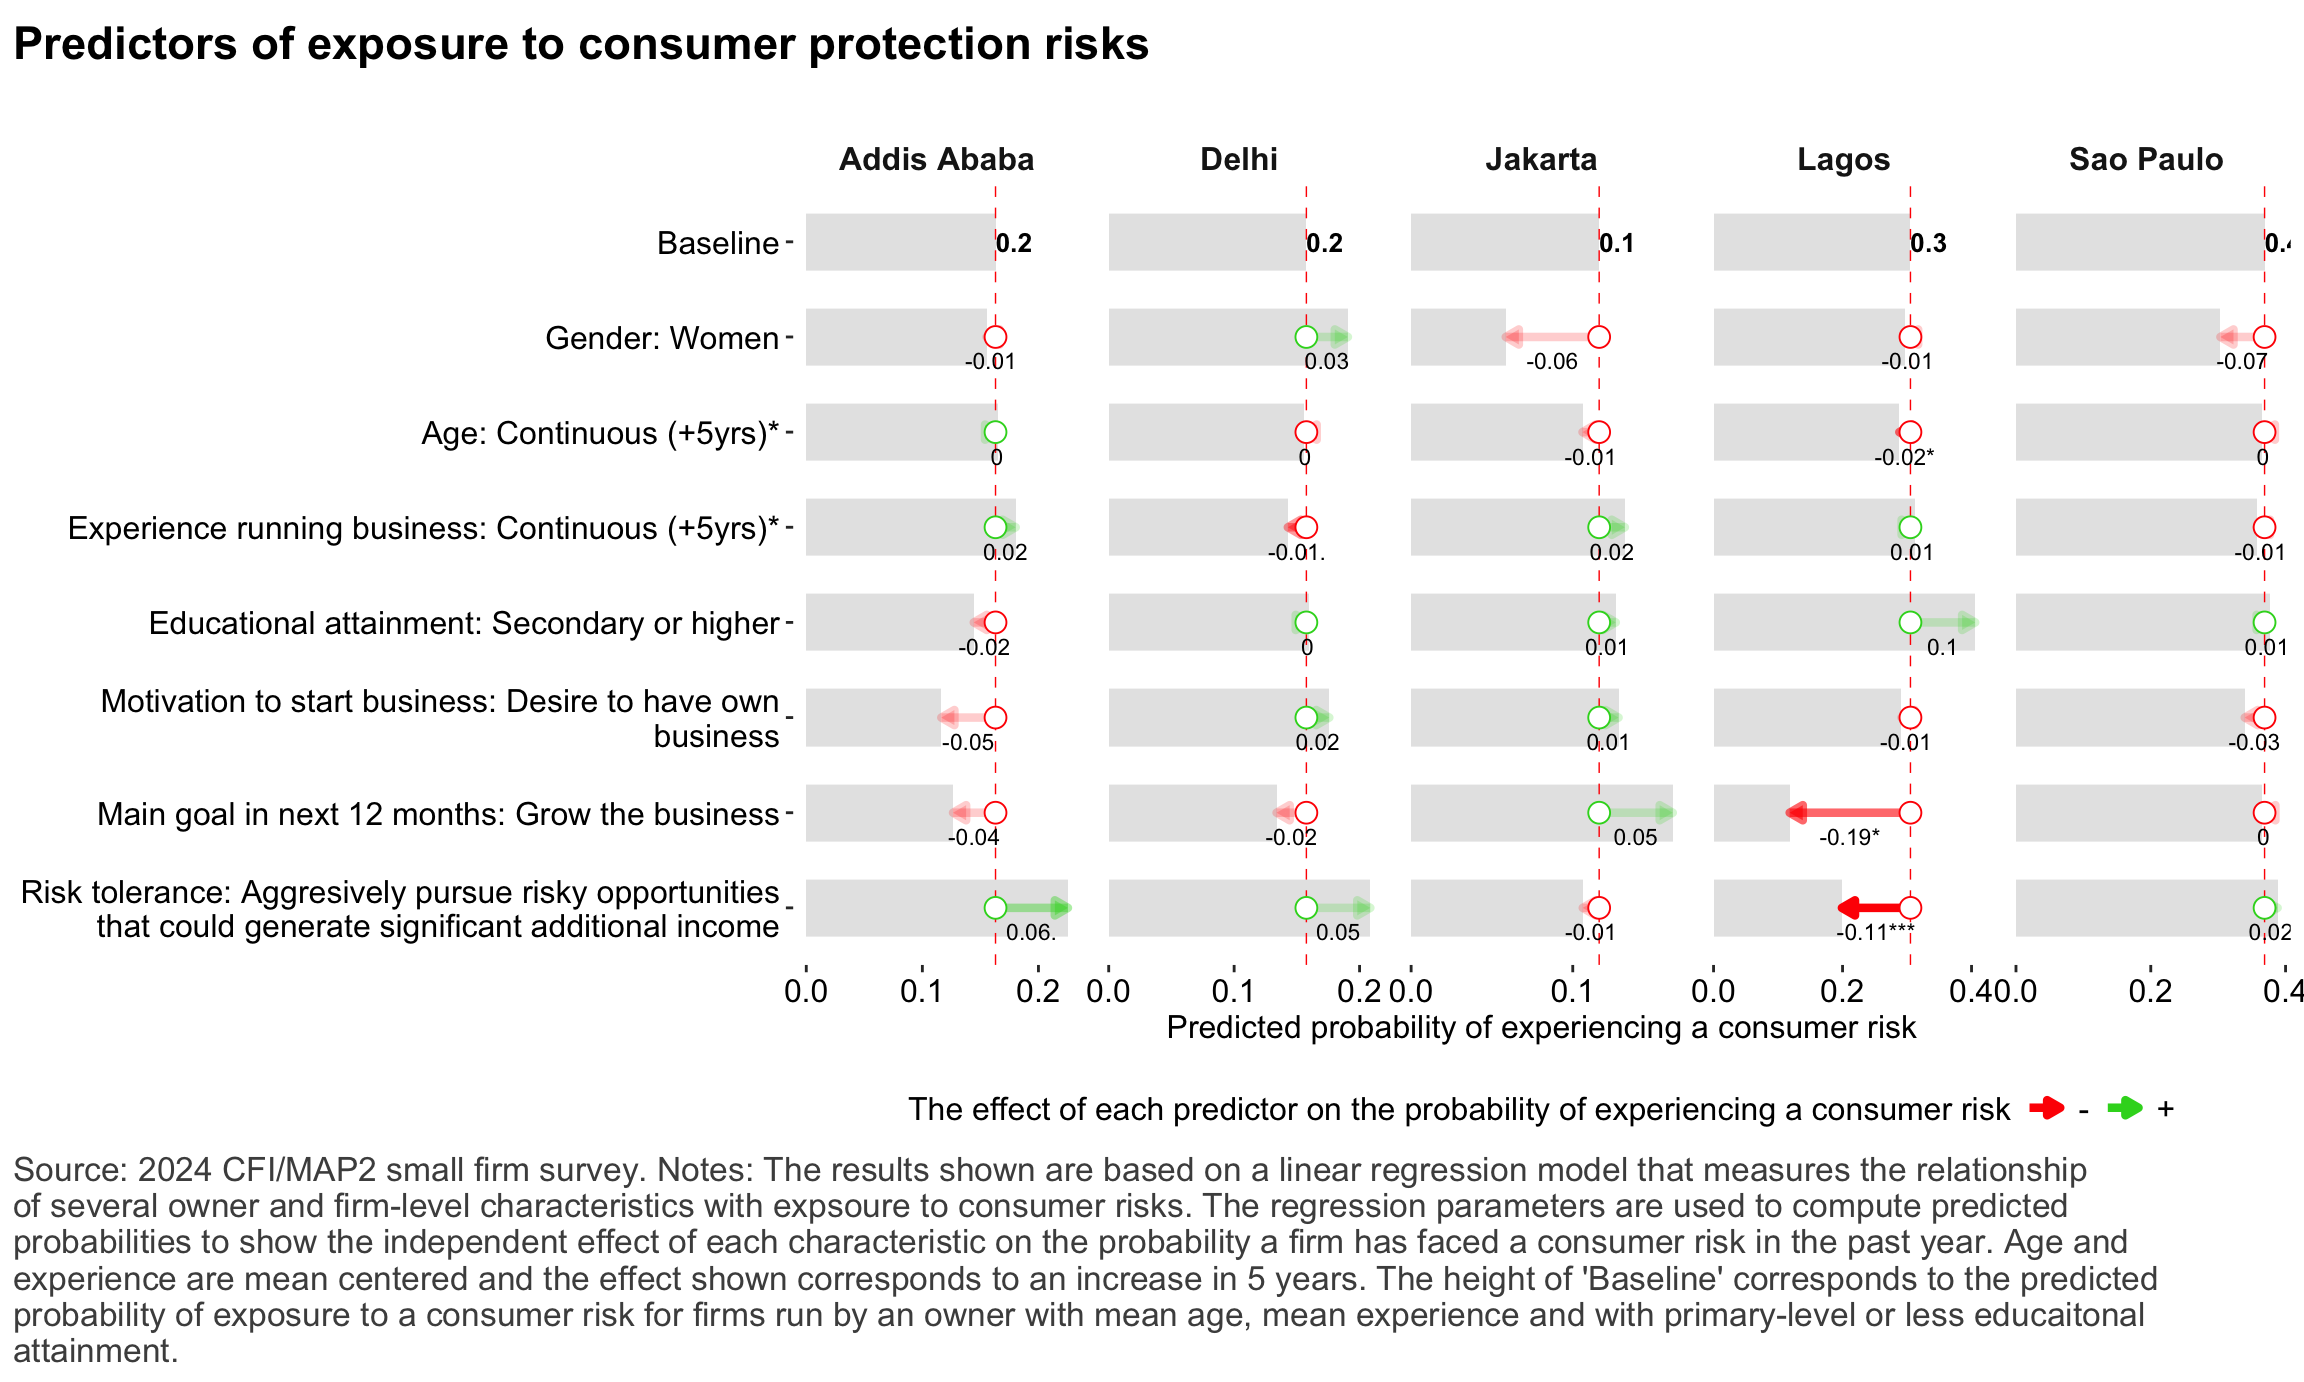
Figure 38: Predictors of consumer protection risks: Demographics
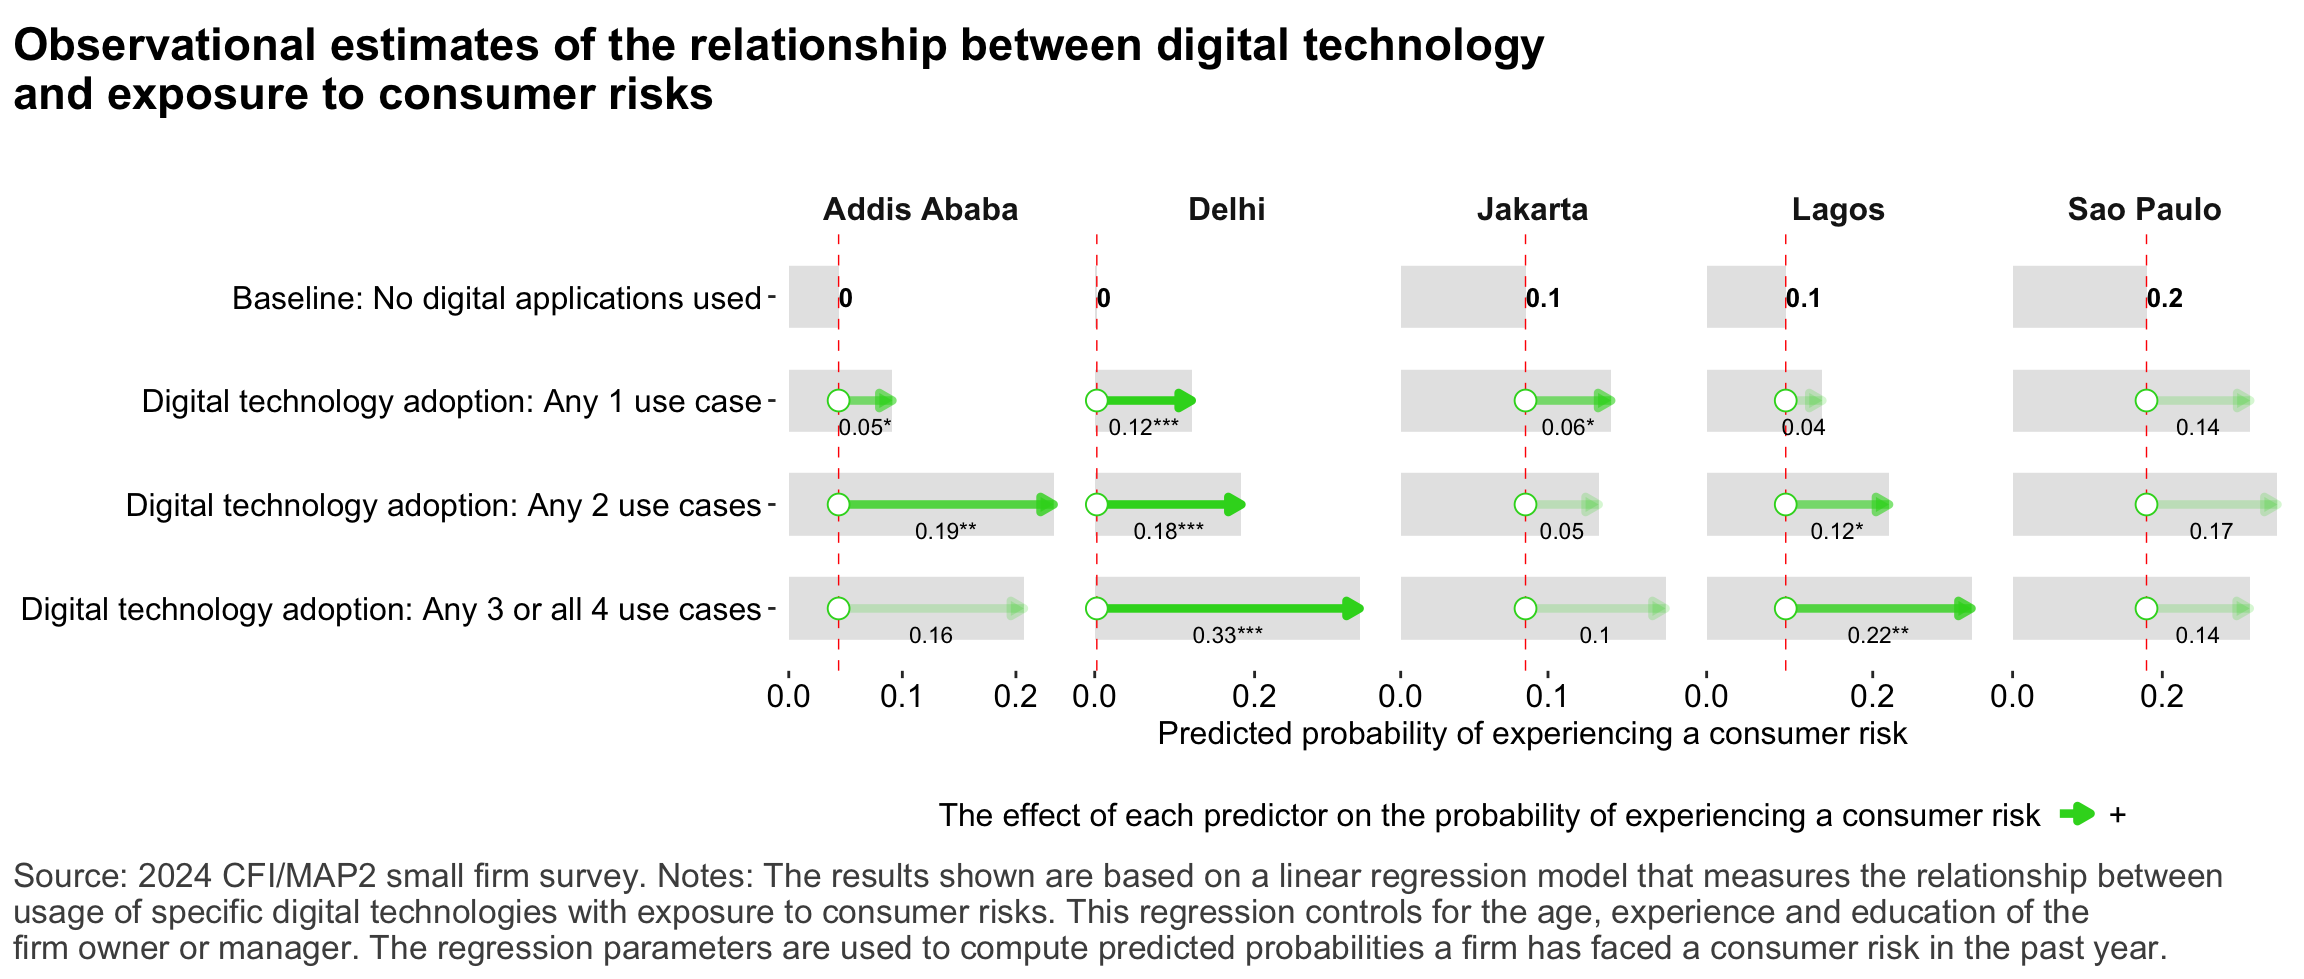
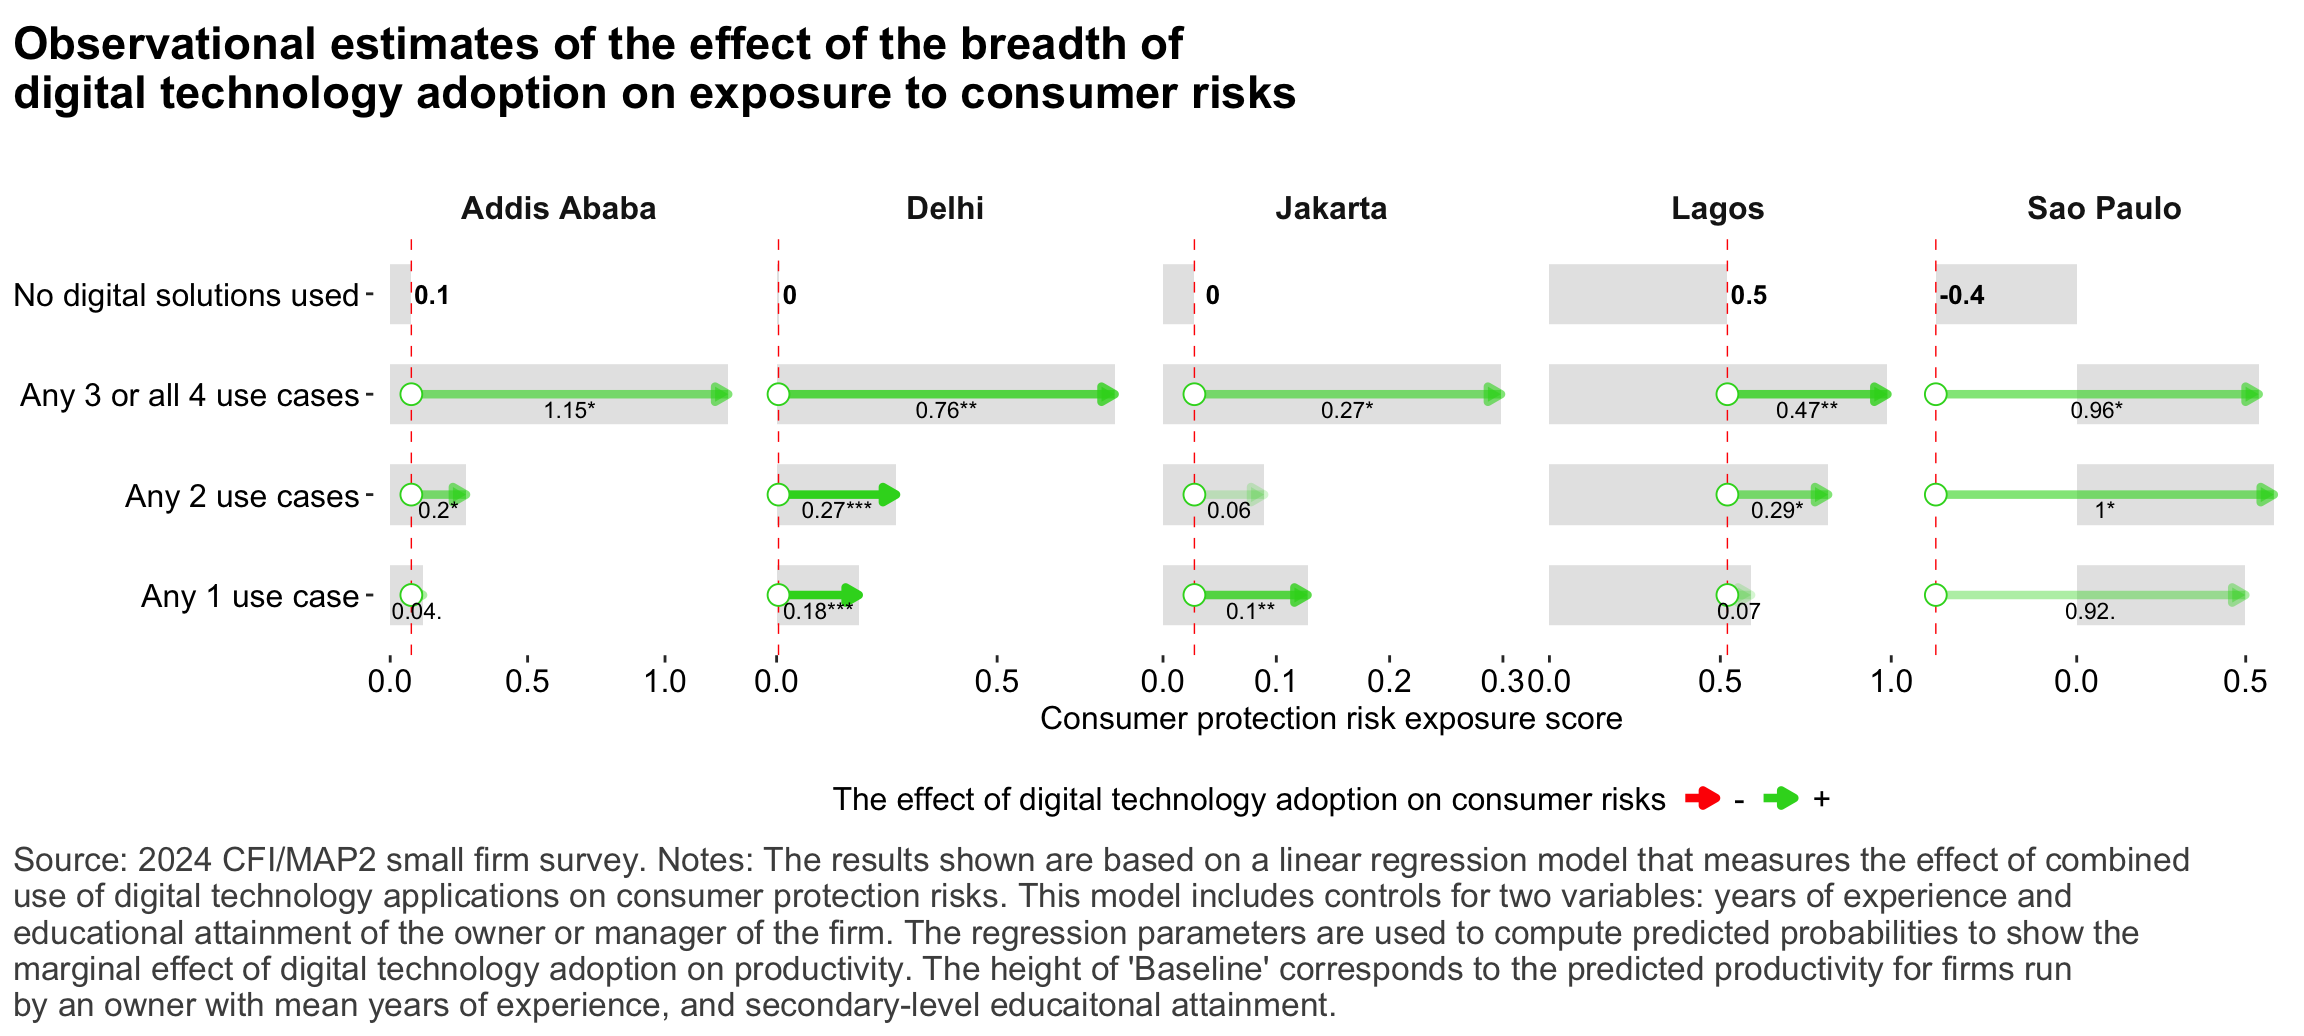
Figure 39: Predictors of exposure to consumer risks: Breadth of digital technologies
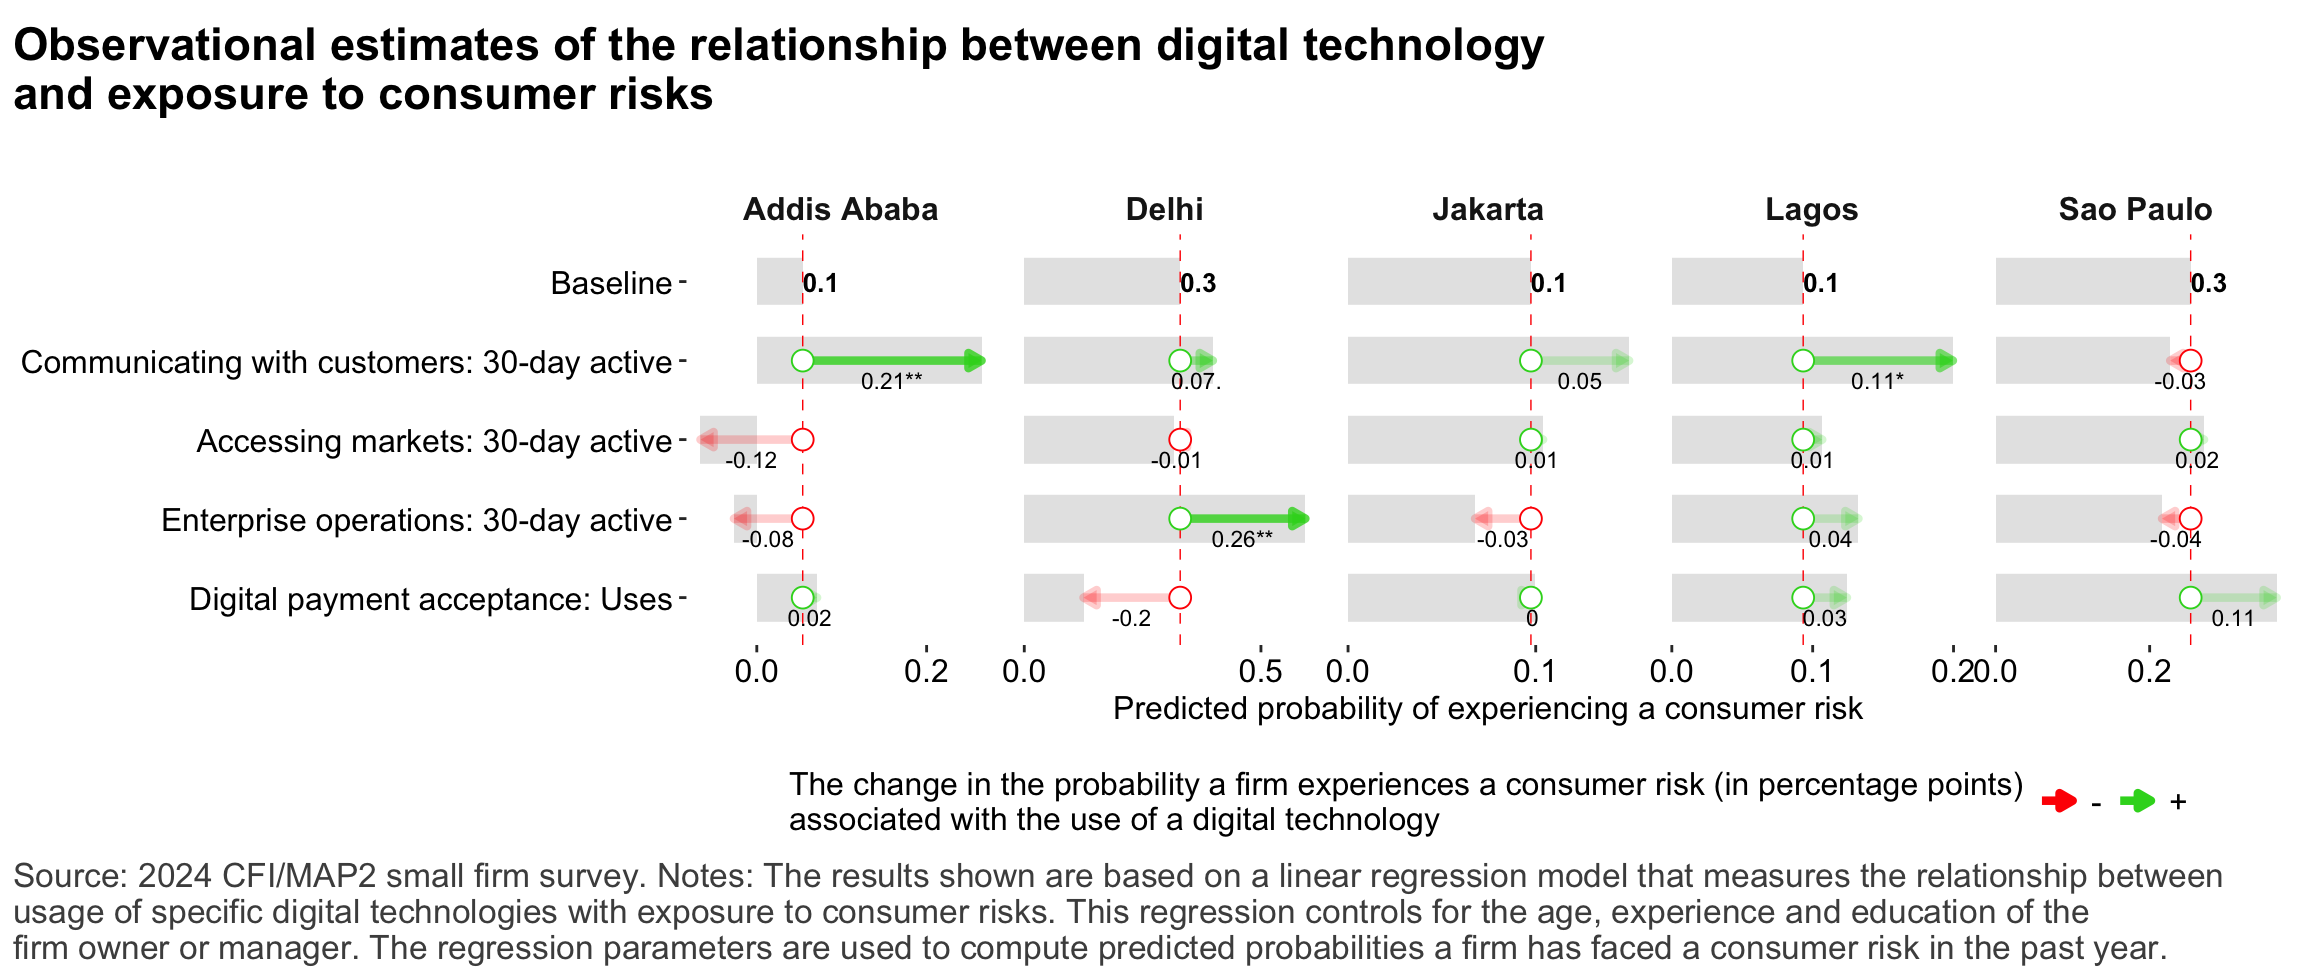
Figure 40: Predictors of exposure to consumer risks: Non-financial digital technologies
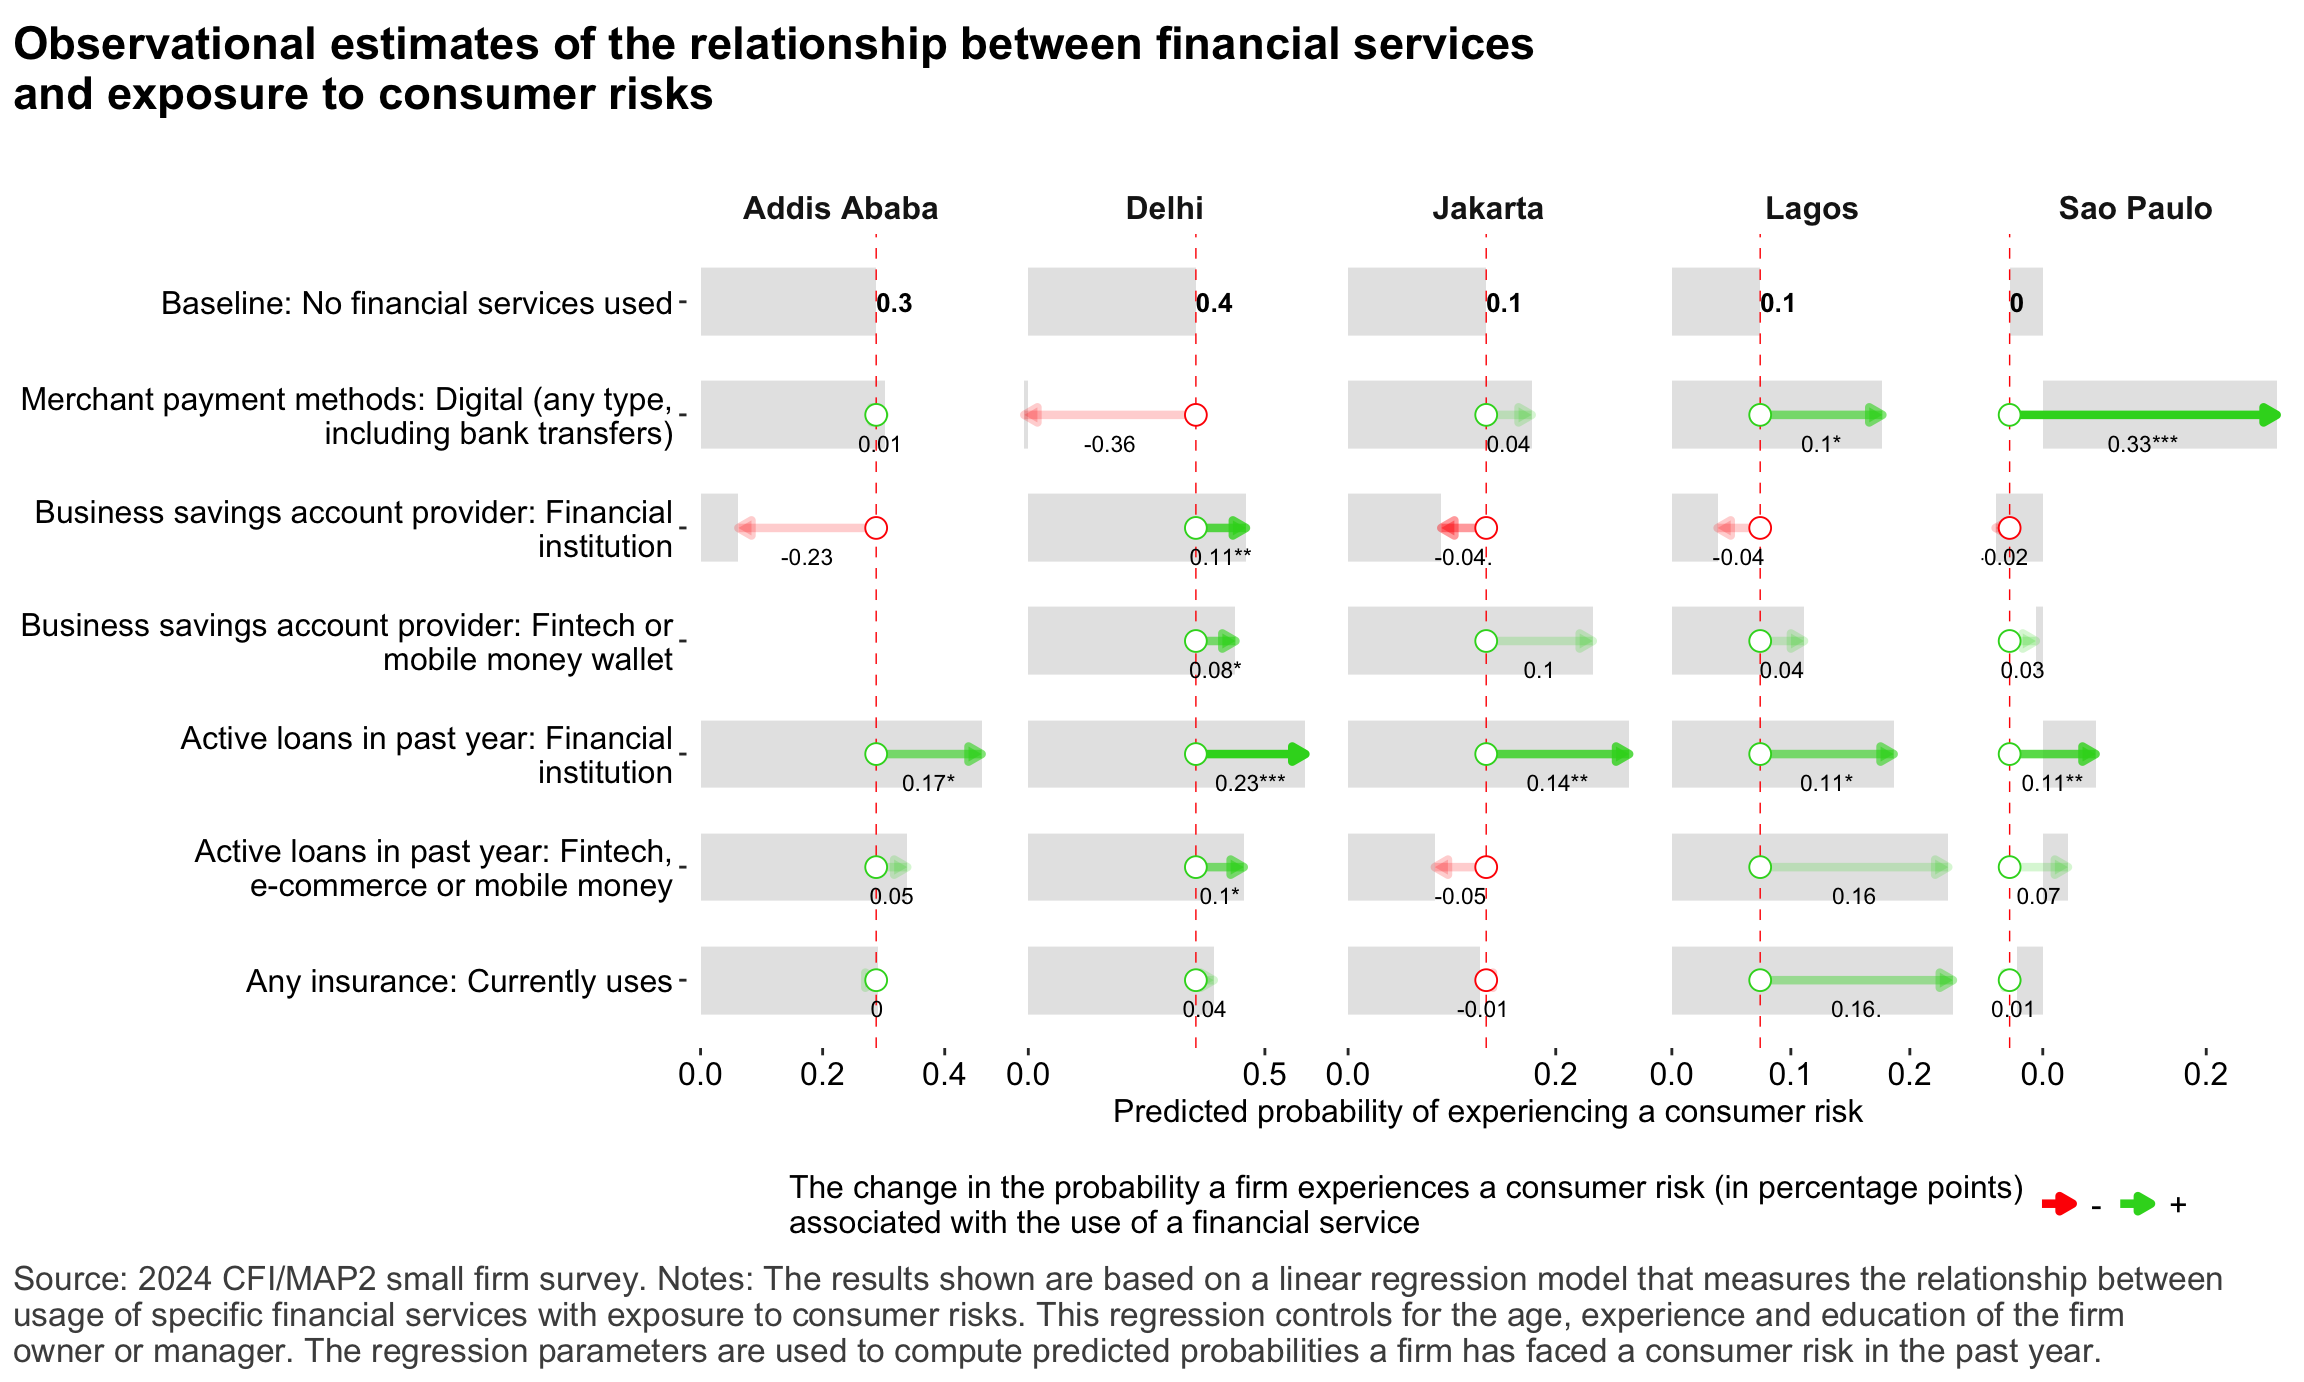
Figure 41: Predictors of exposure to consumer risks: Financial services
Figure 42: Relationship between depth of digital technology adoption and exposure to consumer protection risks
Risks and Resilience
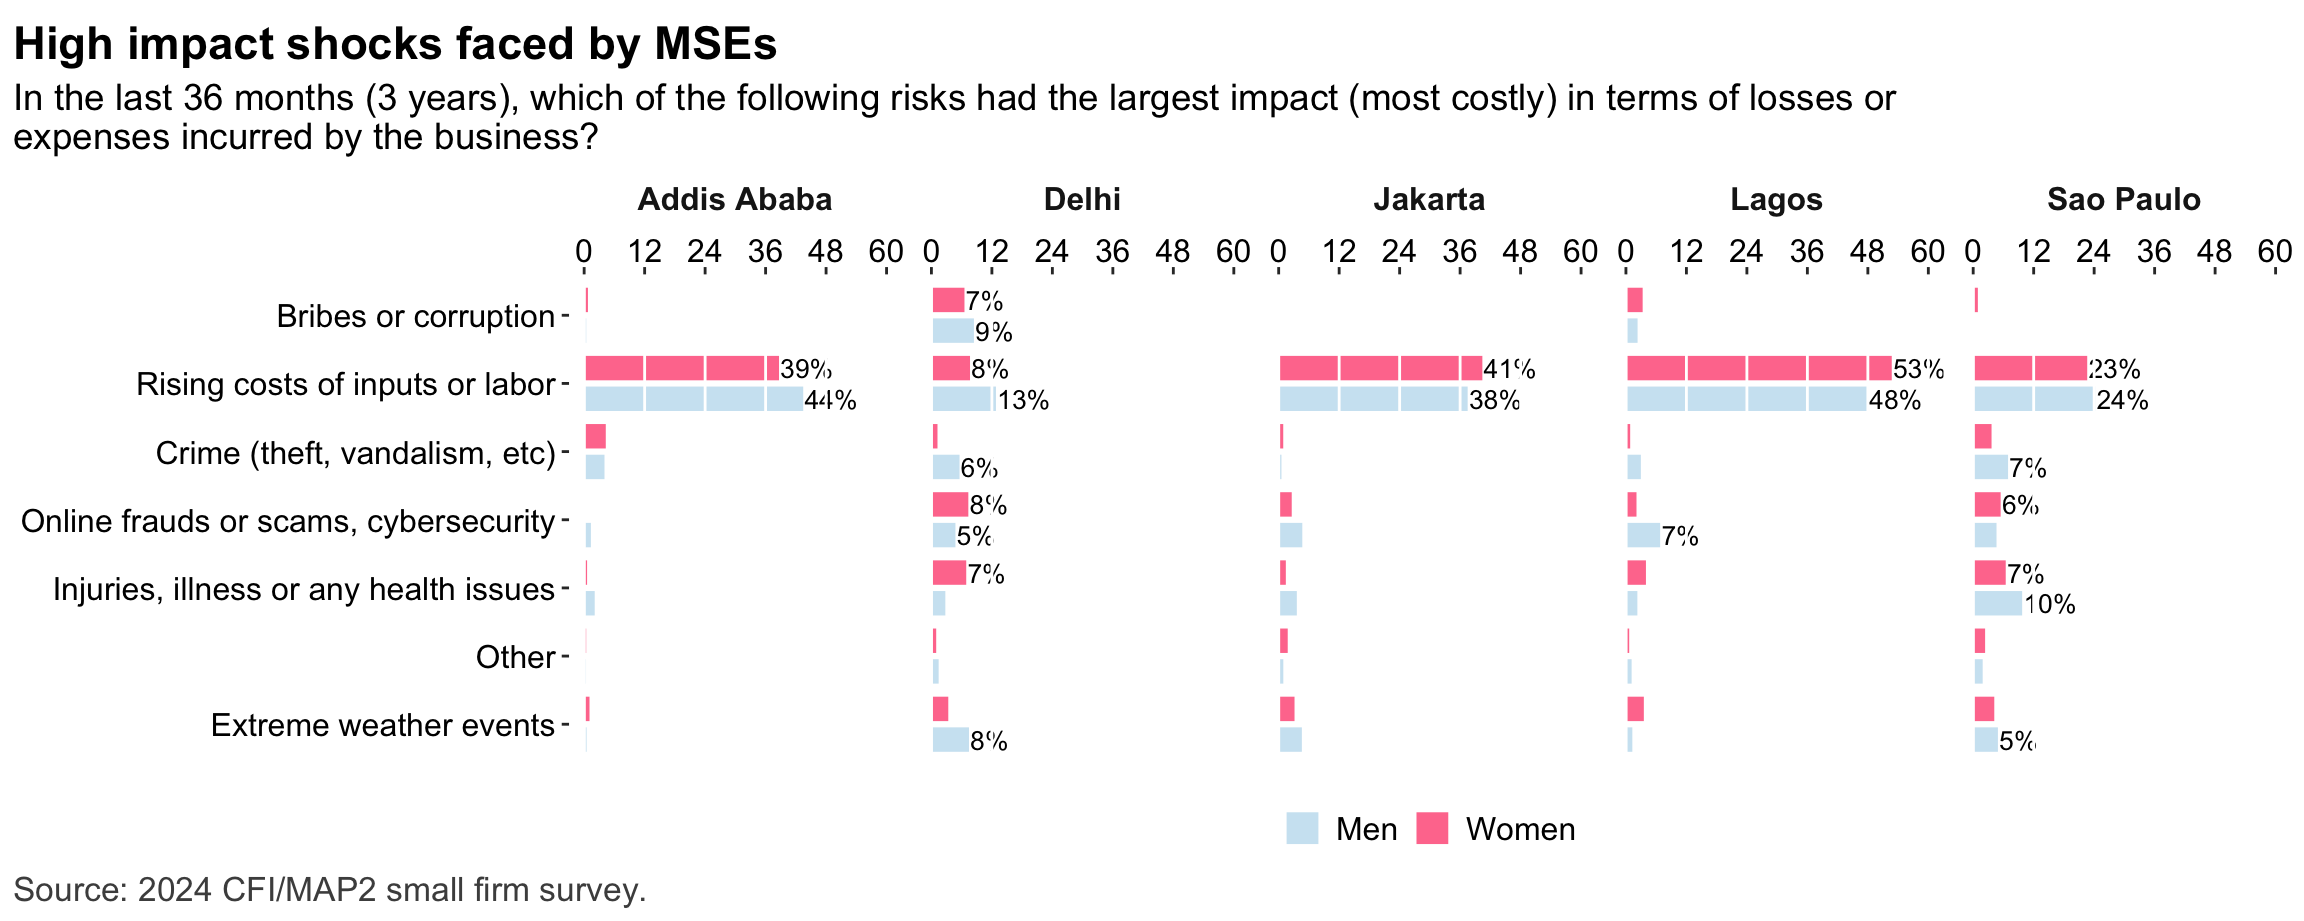
Figure 43: Risks: General
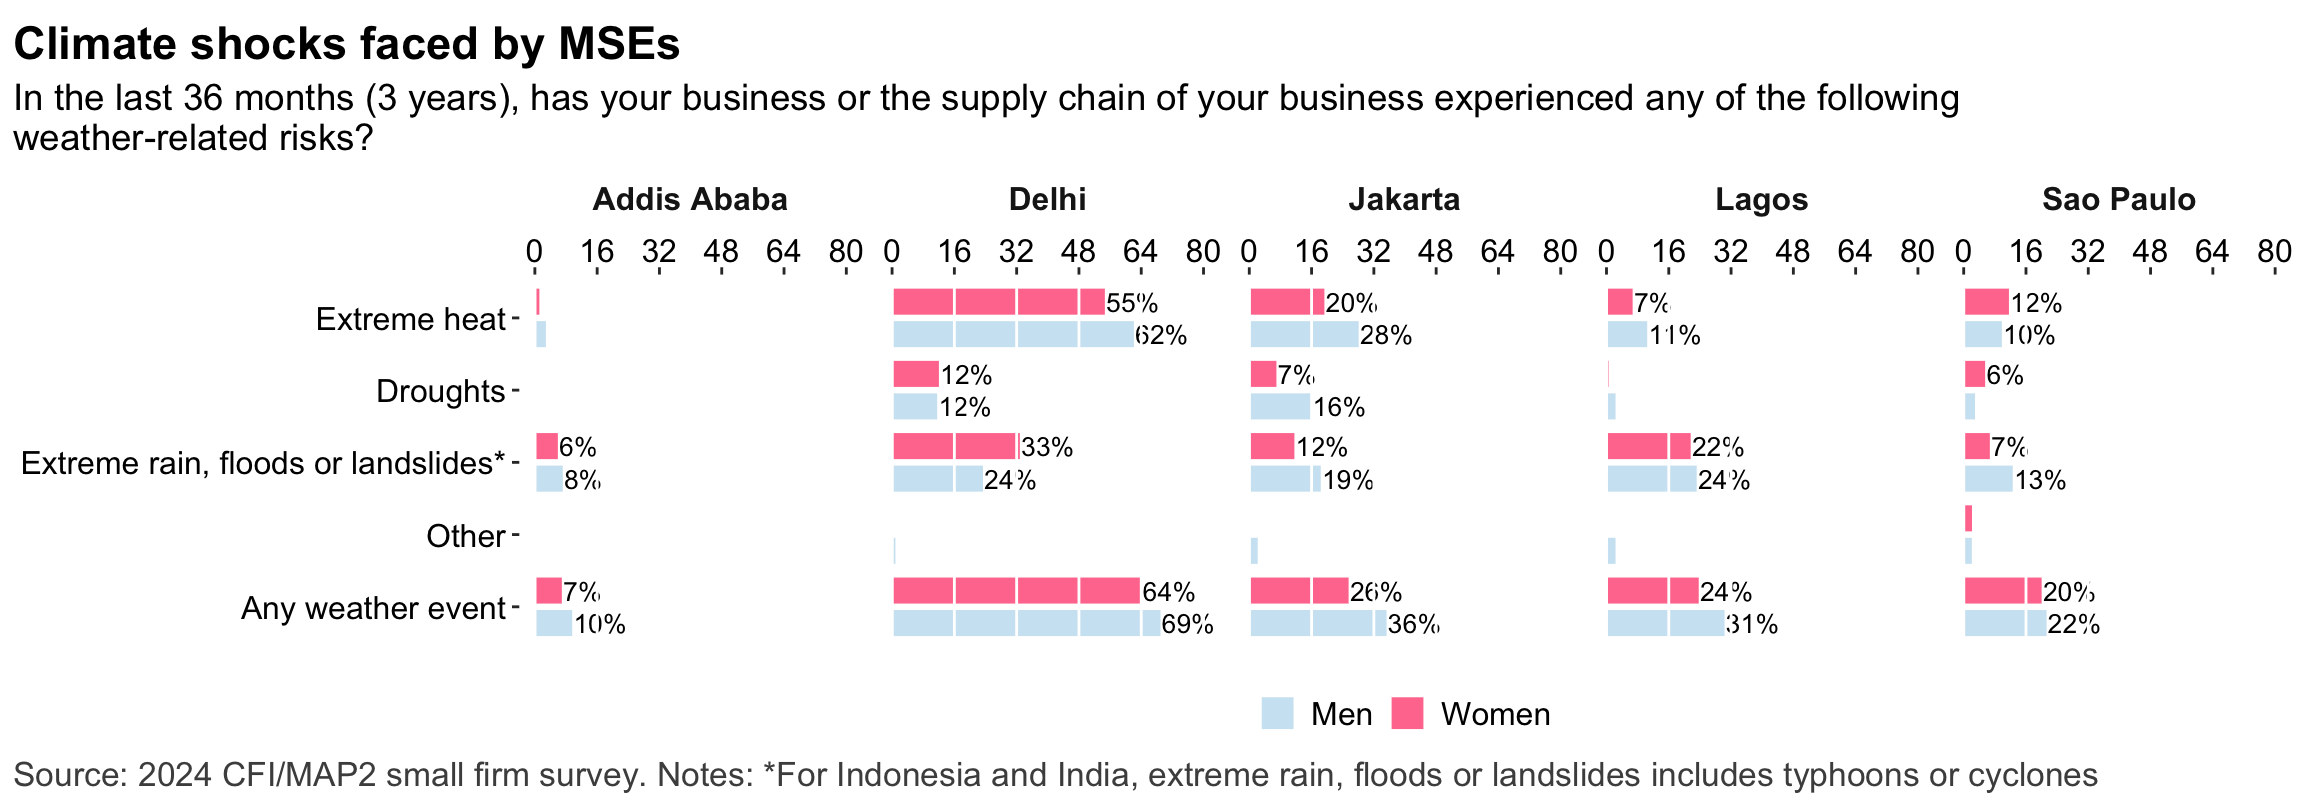
Figure 44: Risks: Climate
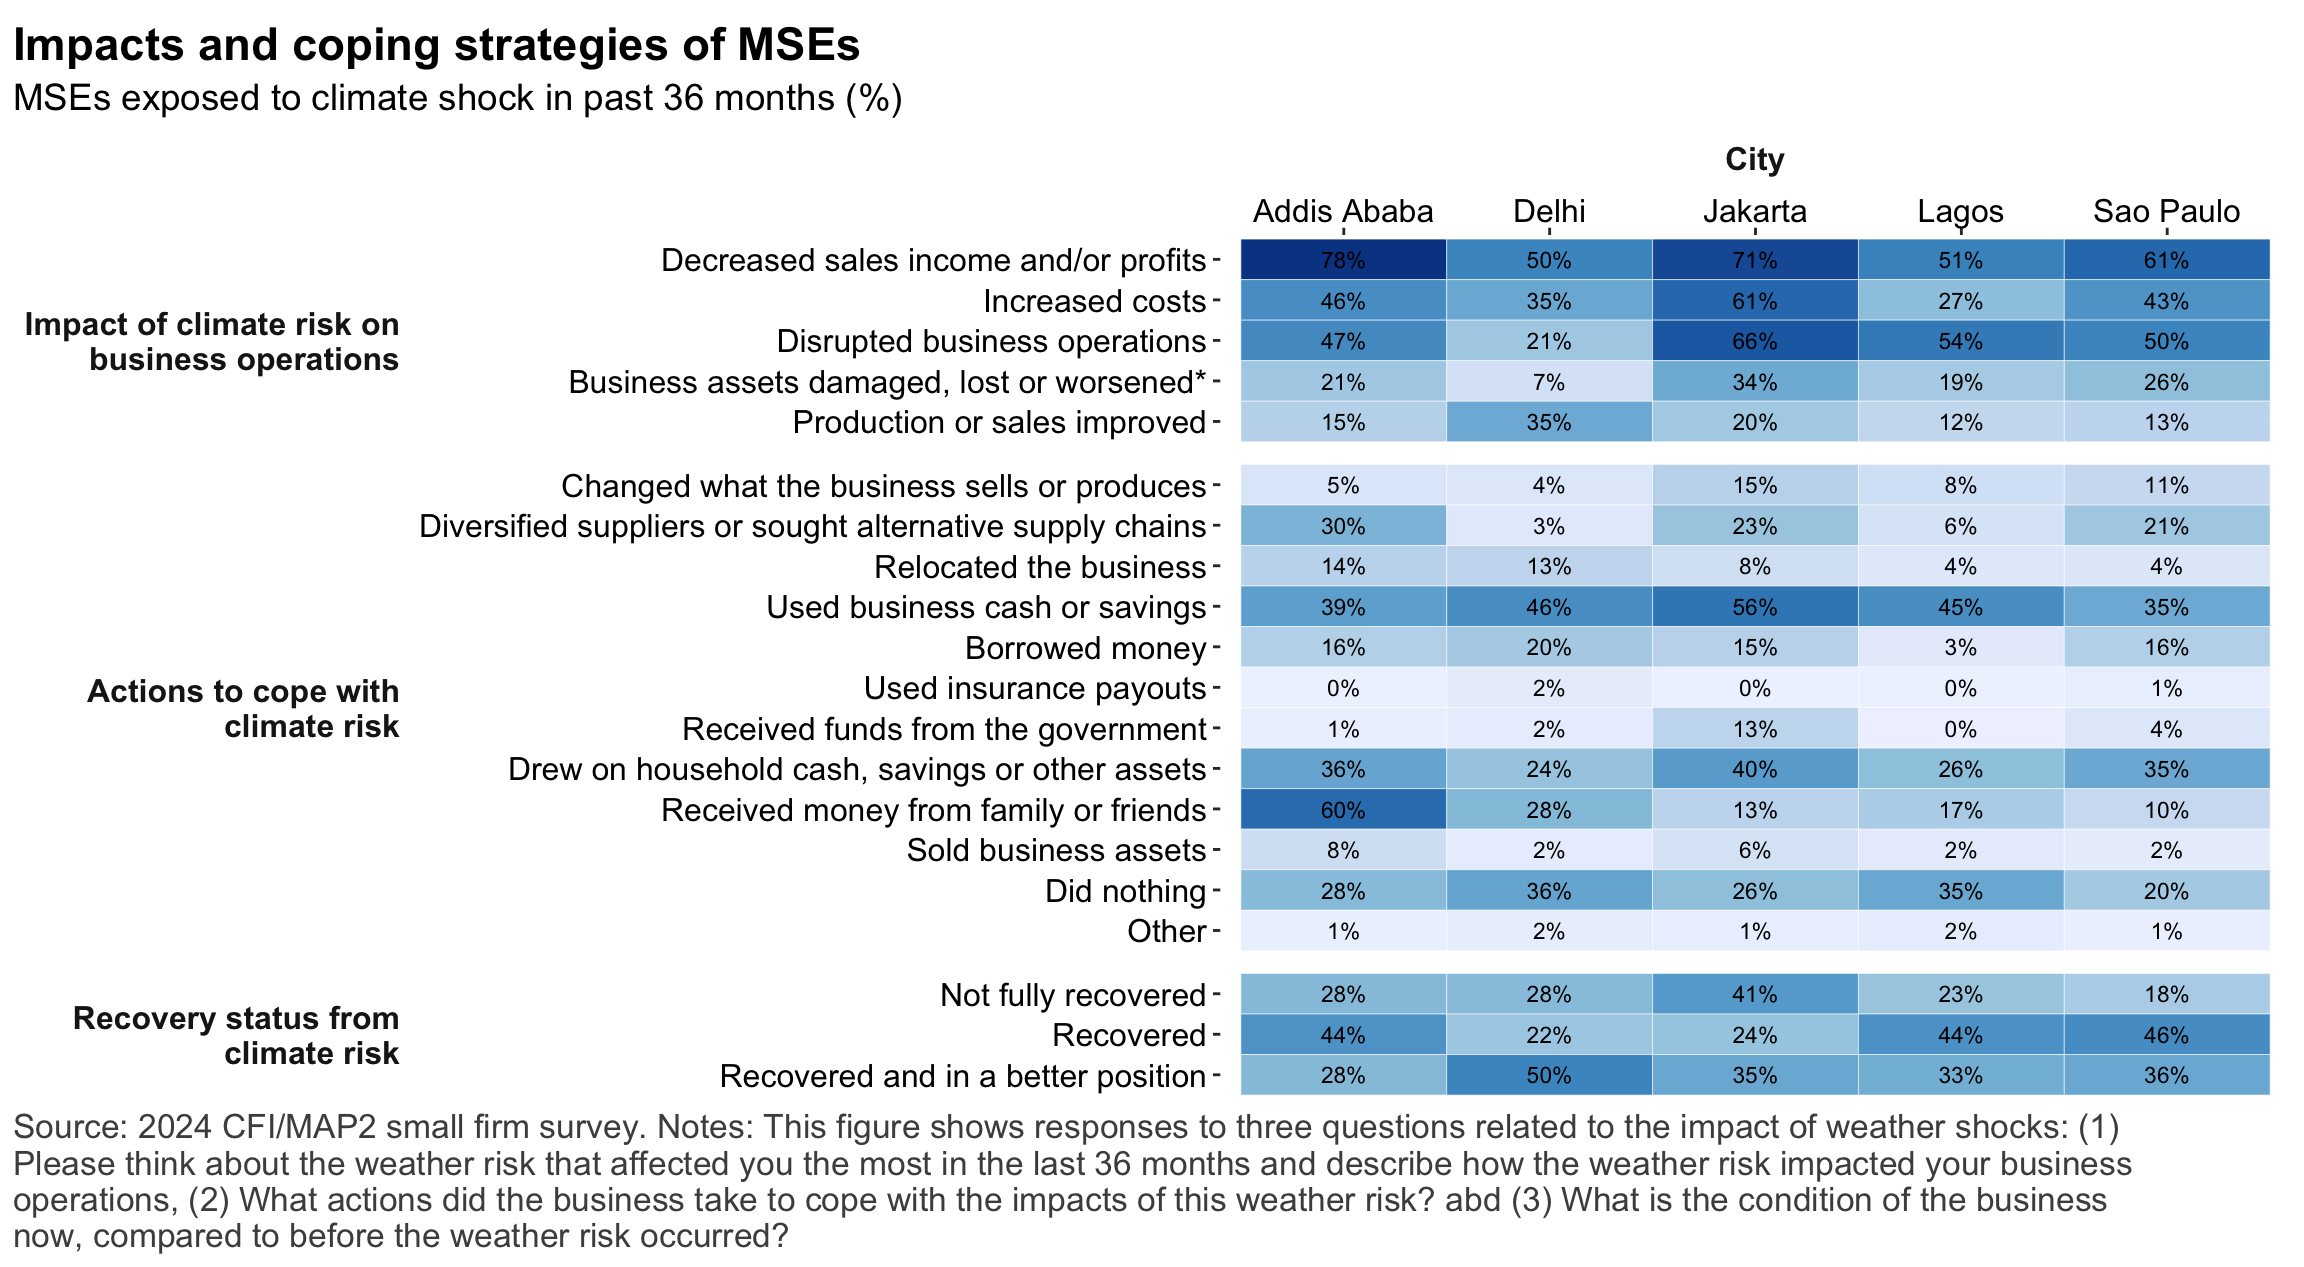
Figure 45: Risks: Impacts
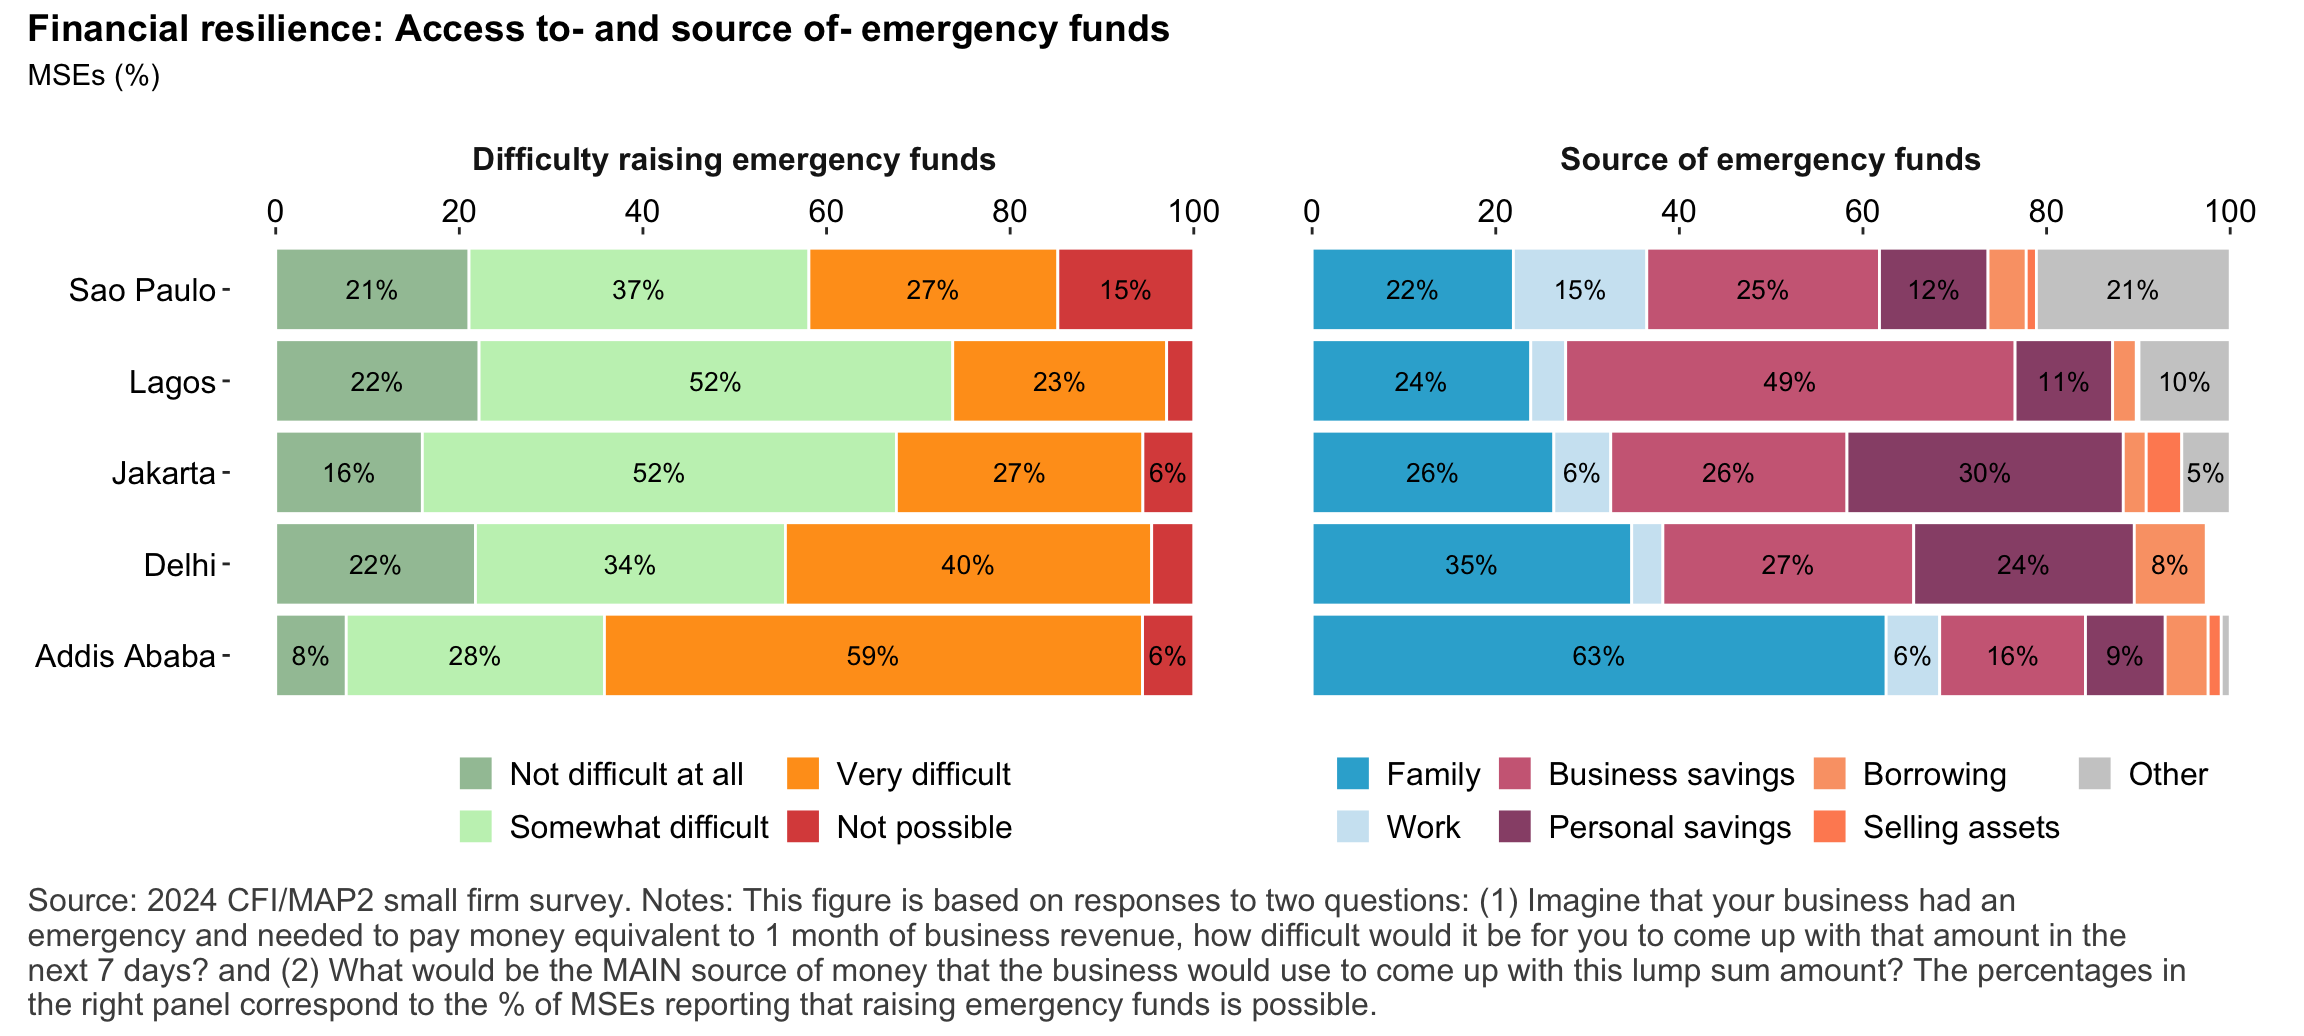
Figure 46: Financial resilience
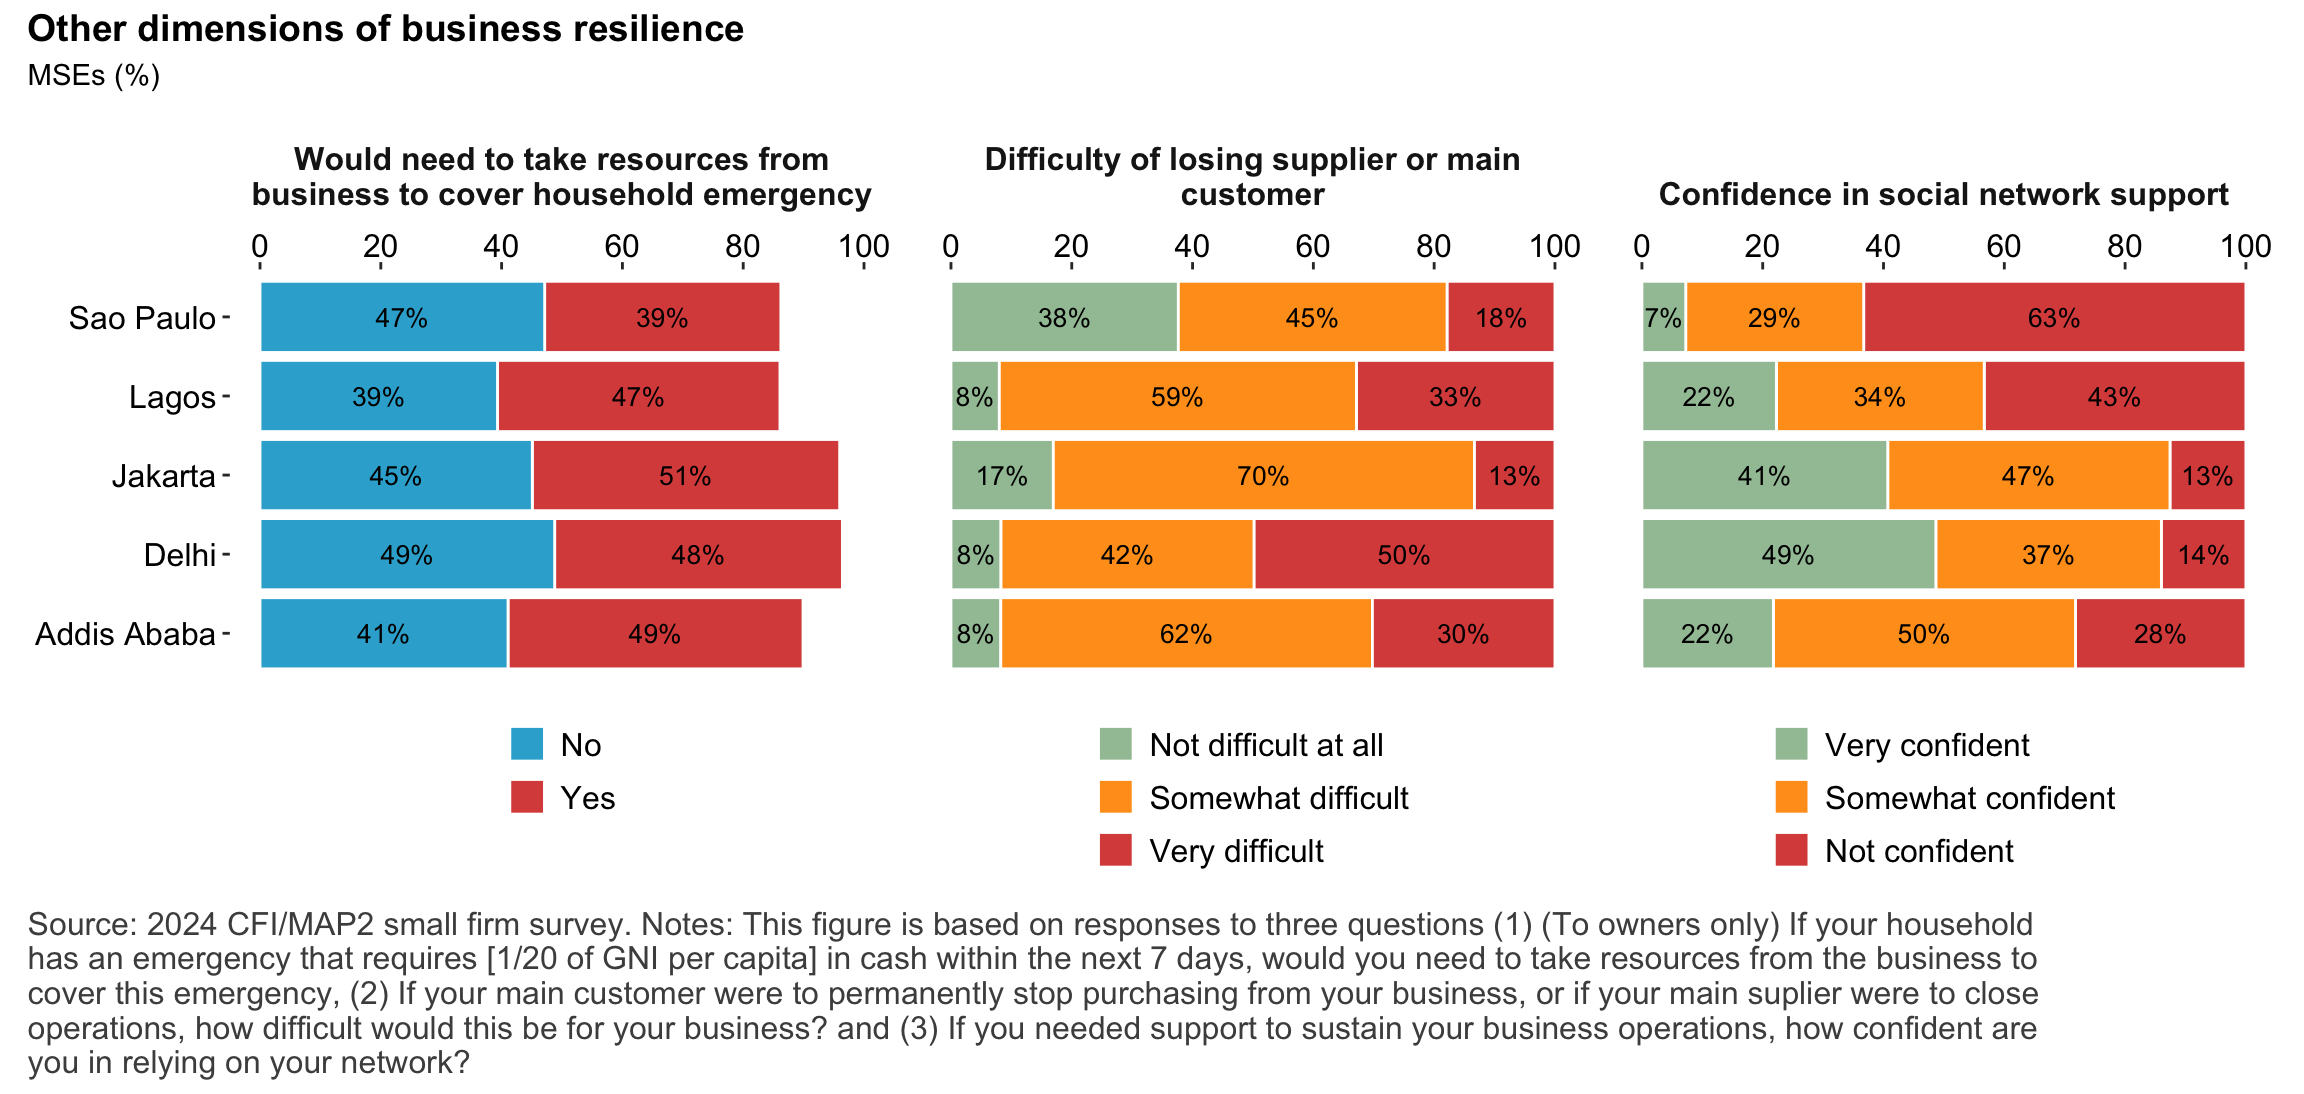
Figure 47: Non-financial dimensions of business resilience
Figure 48: Access to connectivity and devices
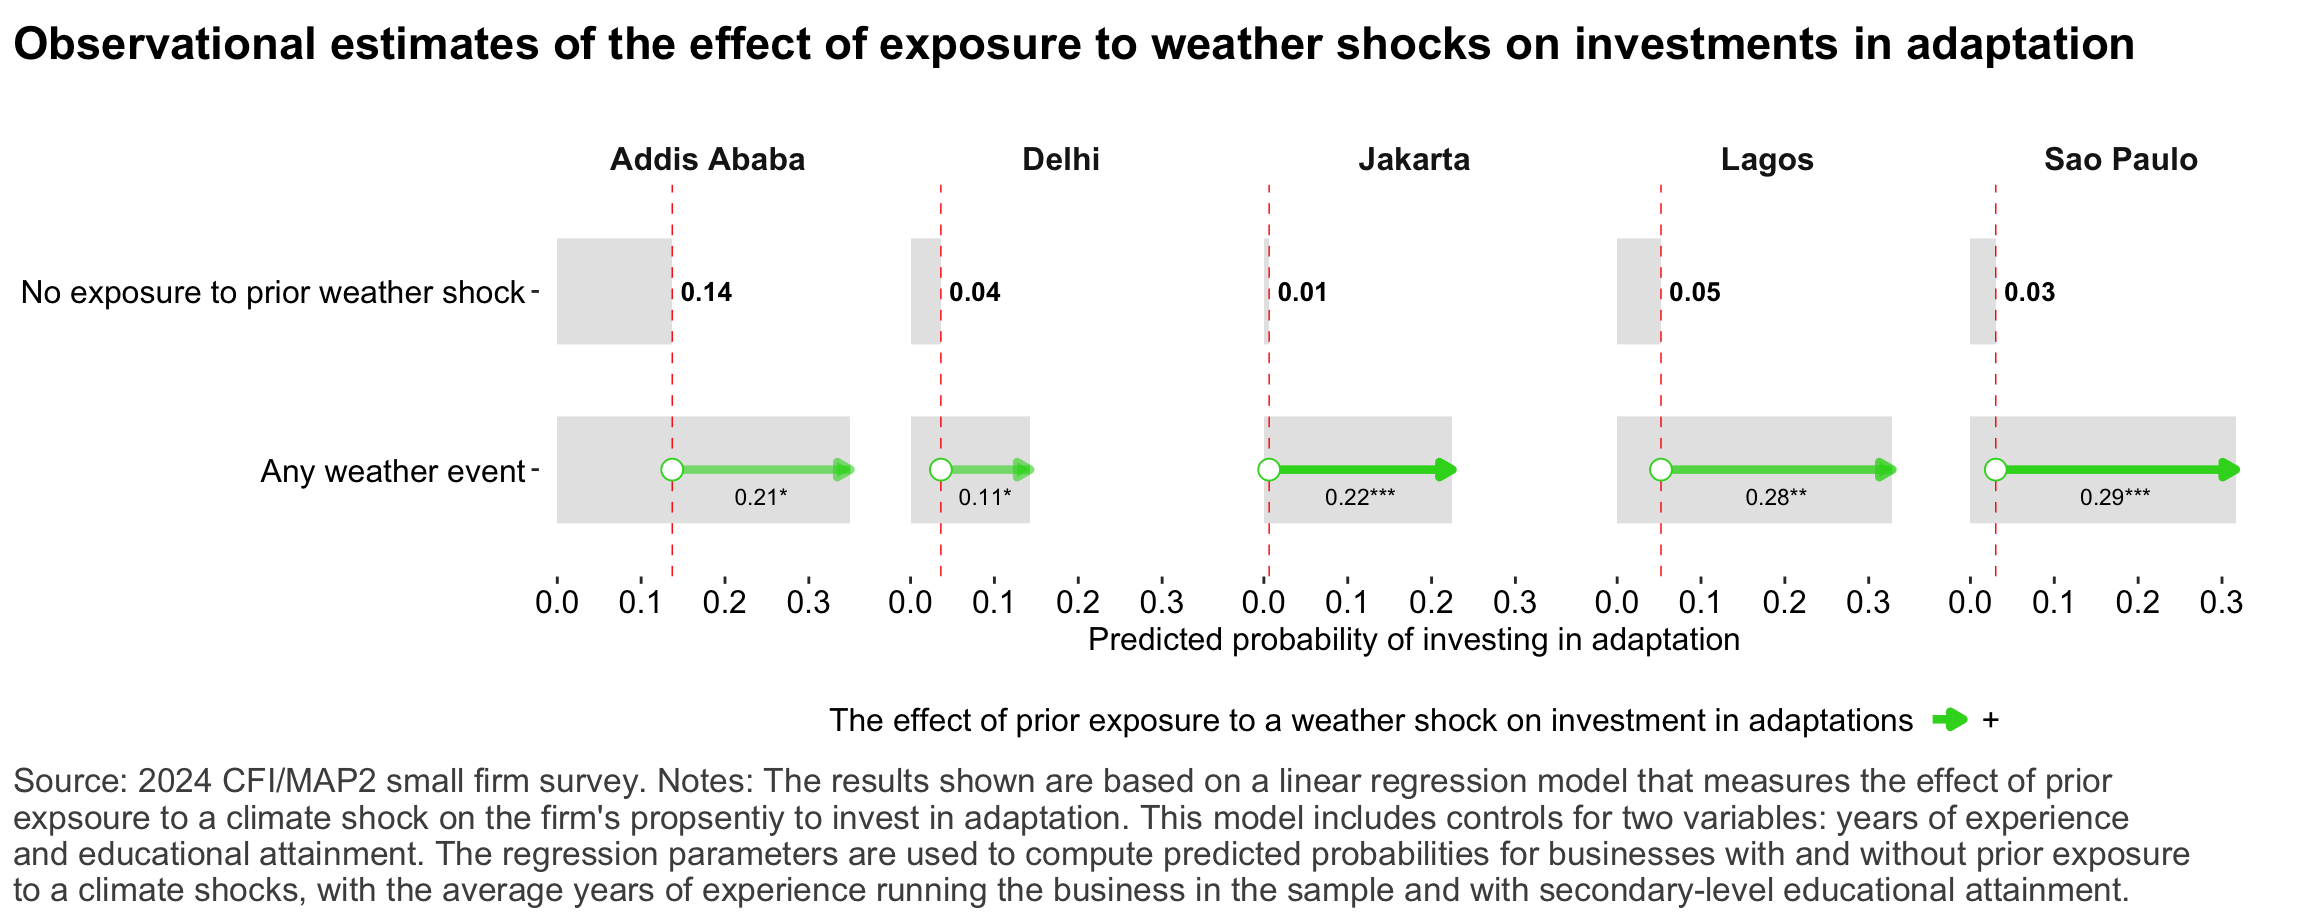
Figure 49: Relationship between prior exposure to weather shock and investment in adaptation
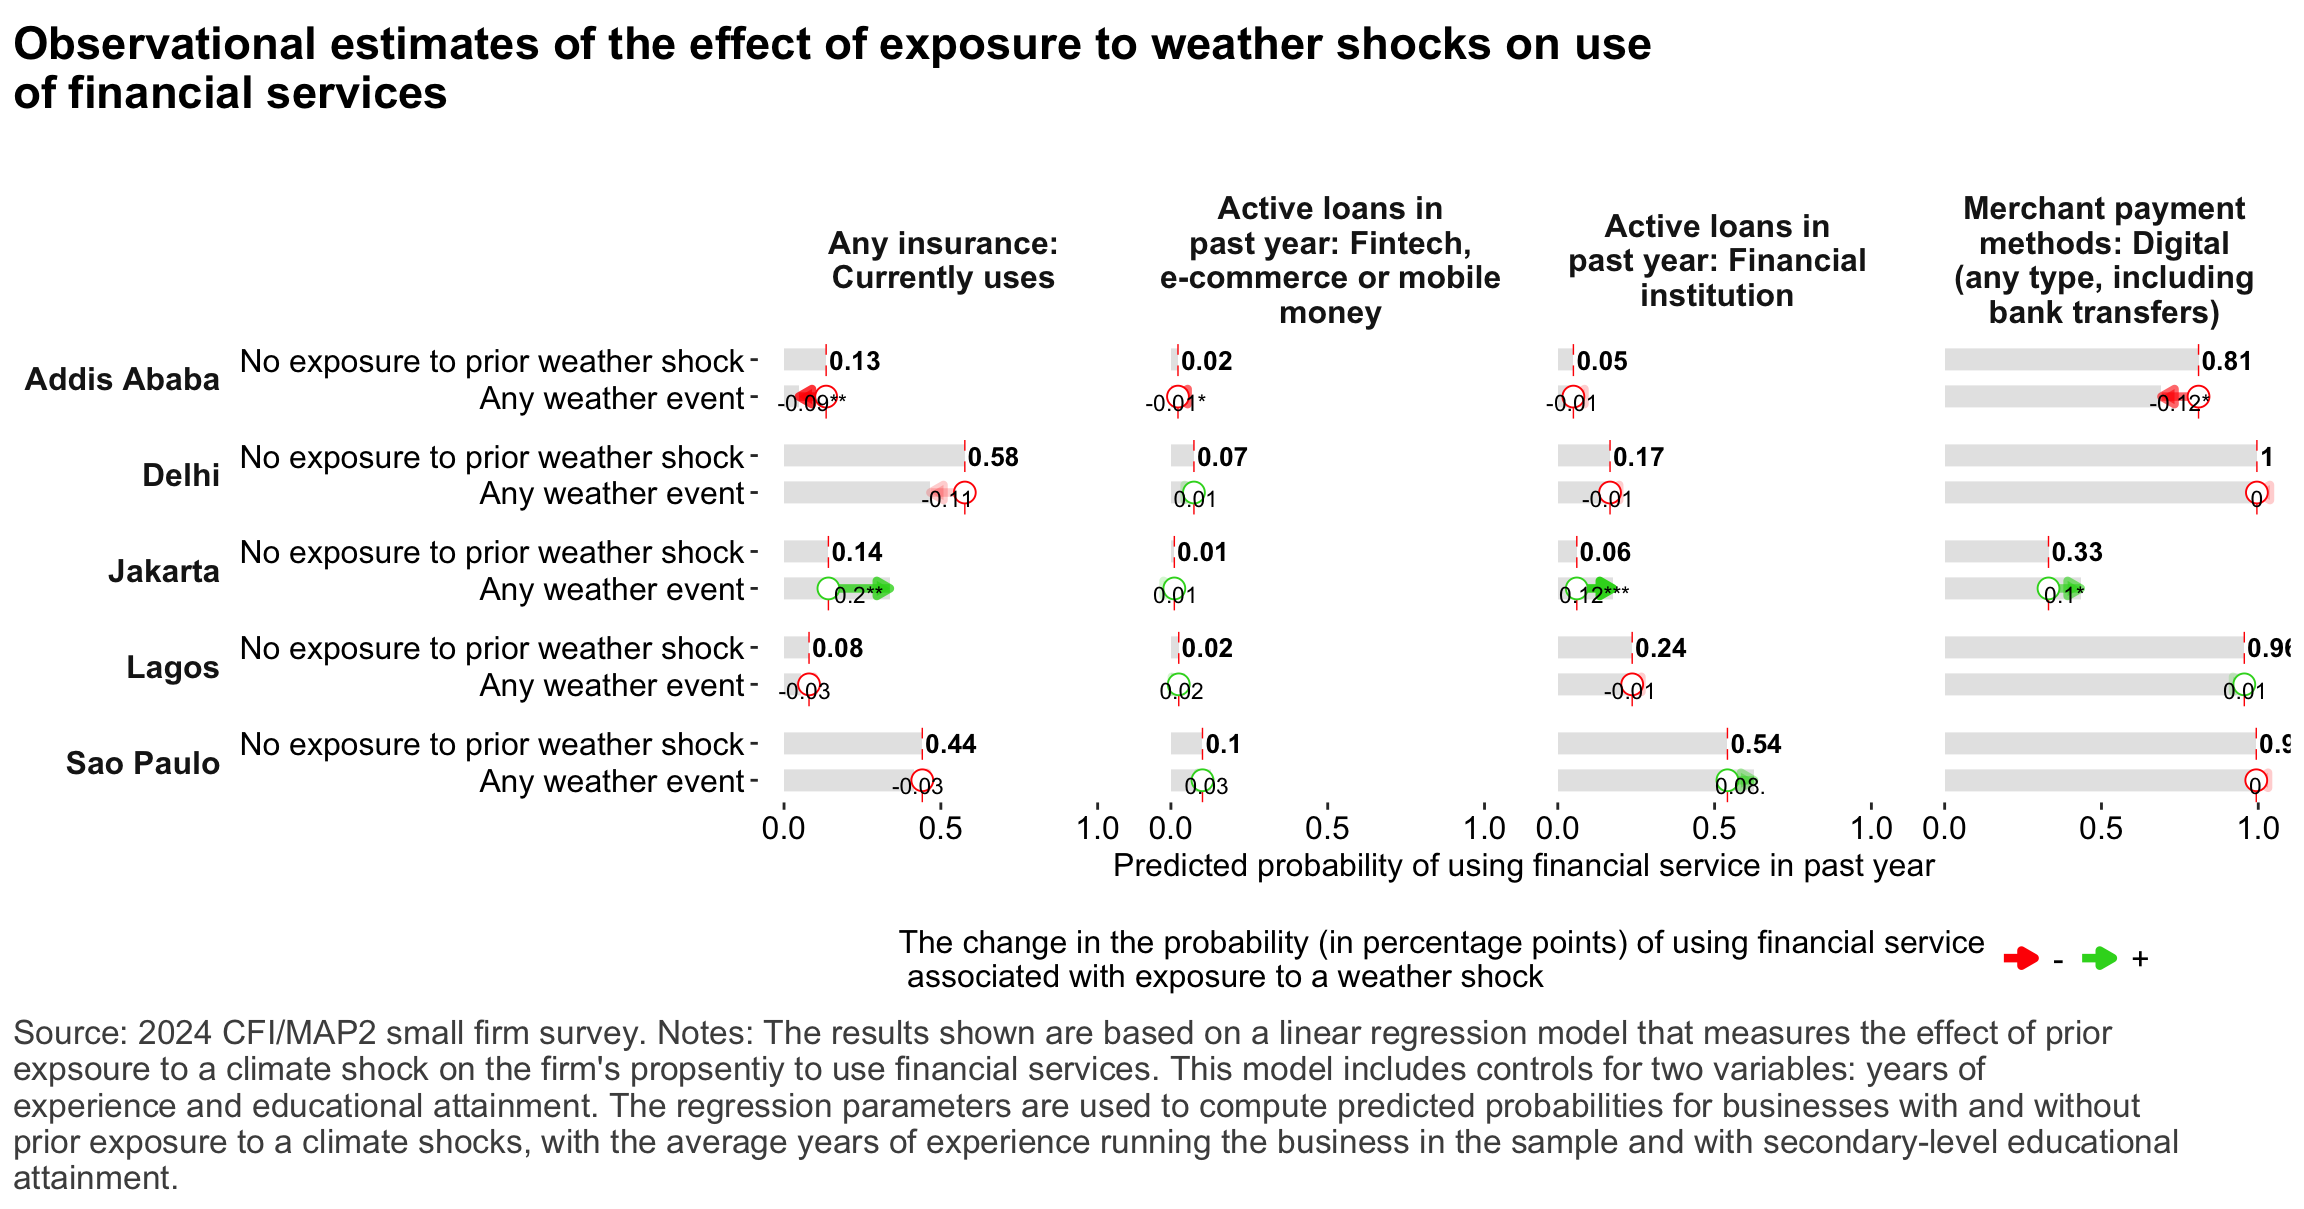
Figure 50: Relationship between prior exposure to weather shock and use of financial services
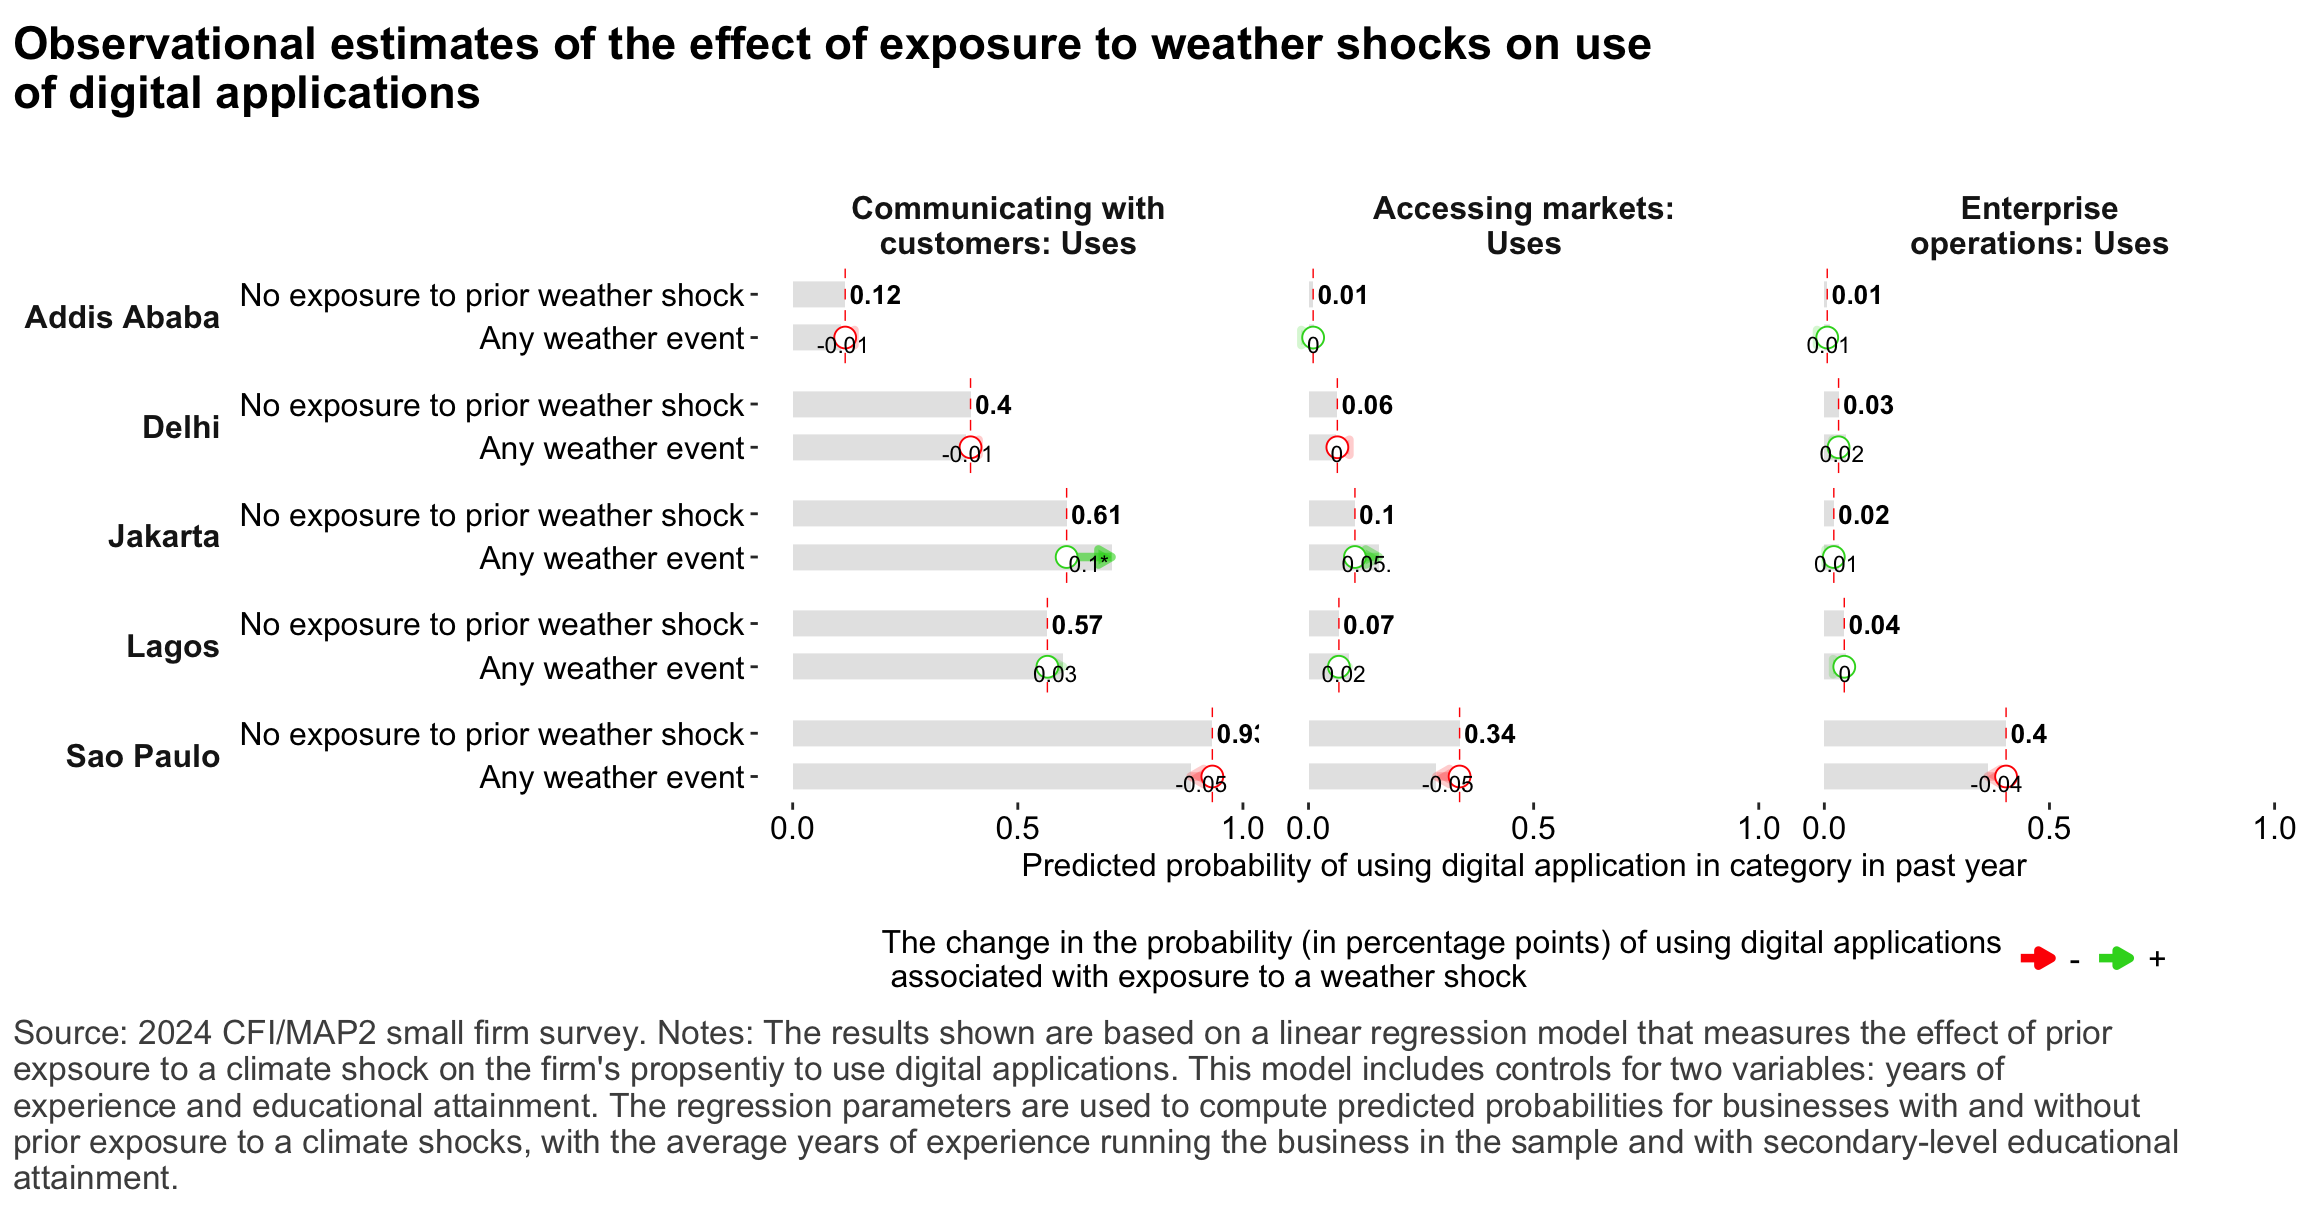
Figure 51: Relationship between prior exposure to weather shock and use of digital tools
Figure 52: Relationship between overall technology adoption & resilience
Annex
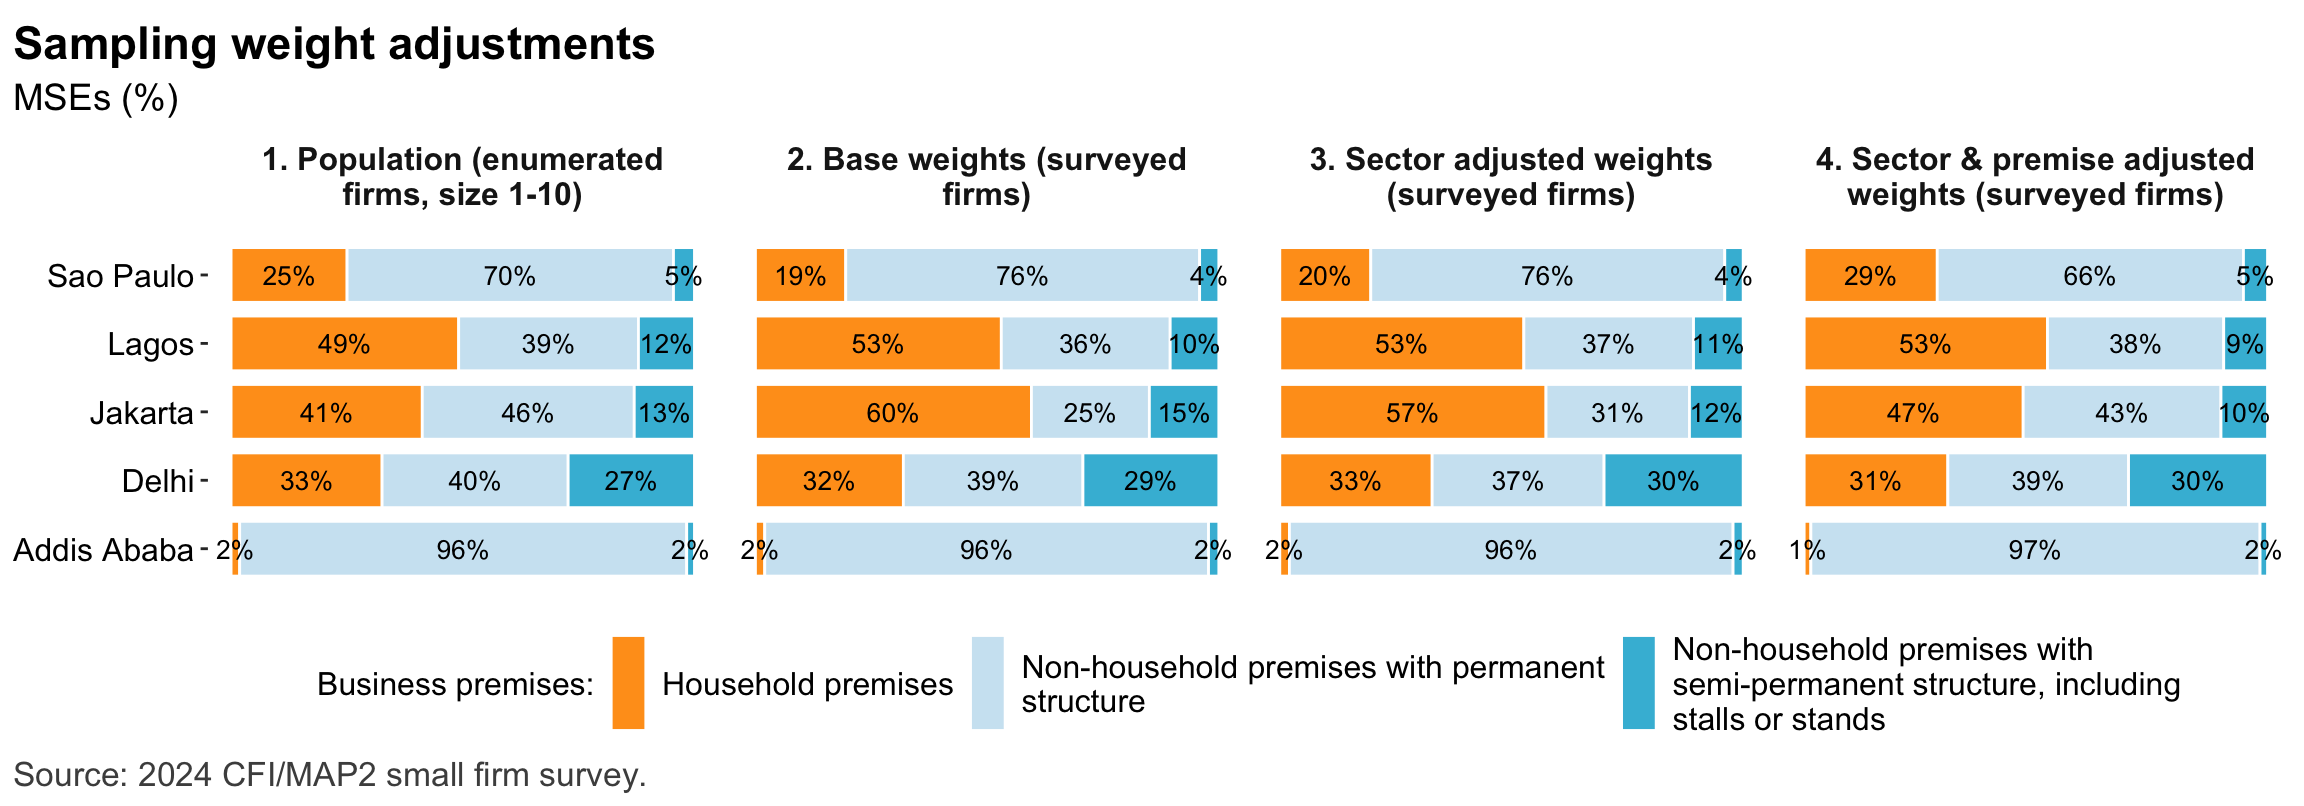
Figure 53: MSEs by premises type
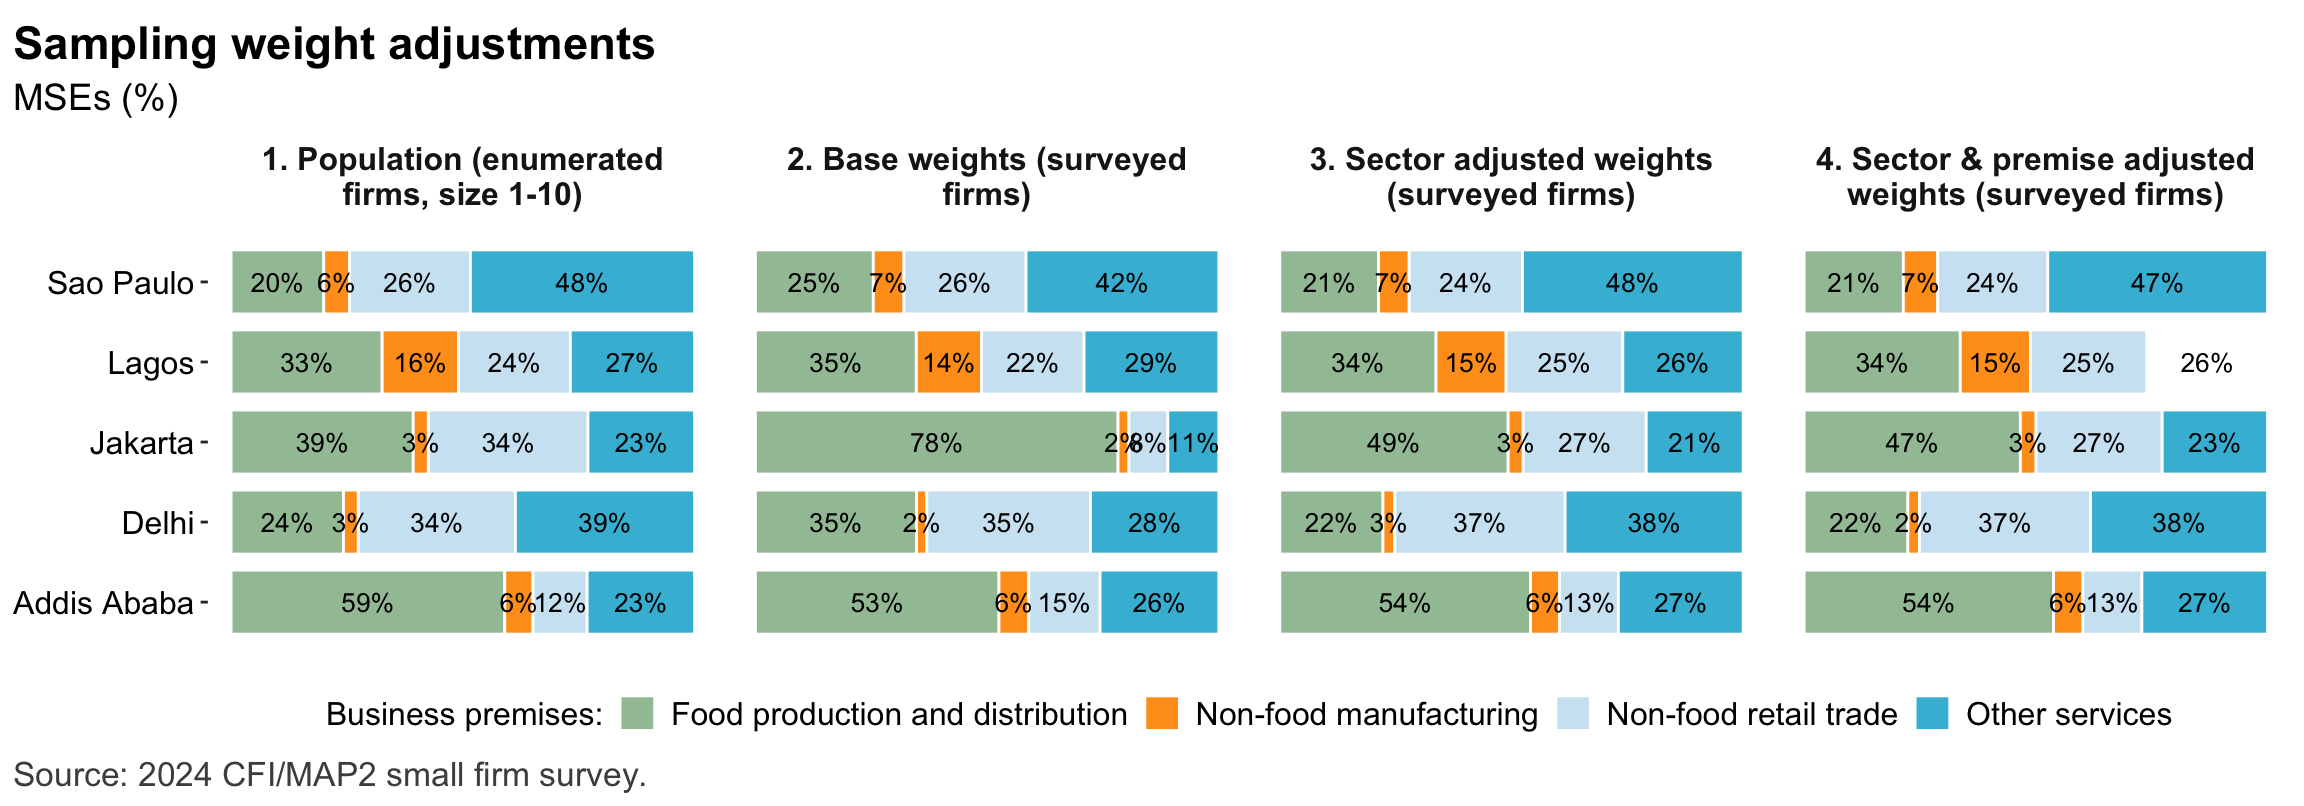
Figure 54: MSES by sector
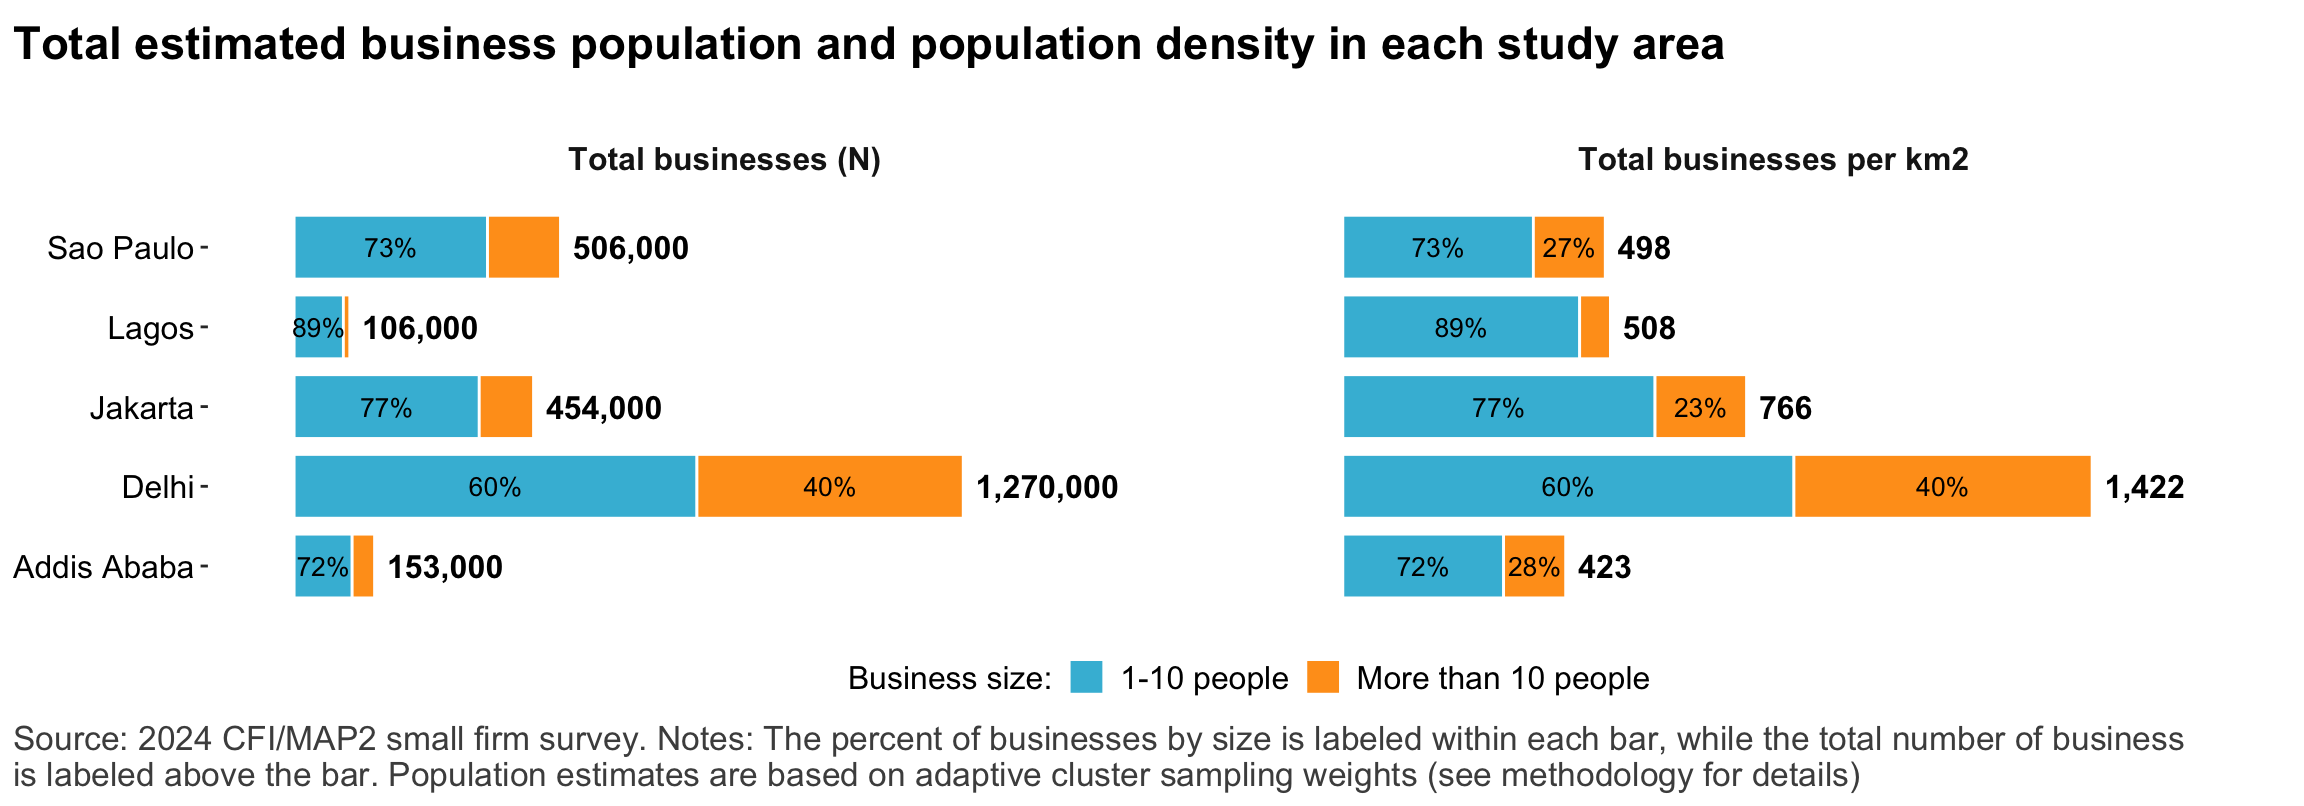
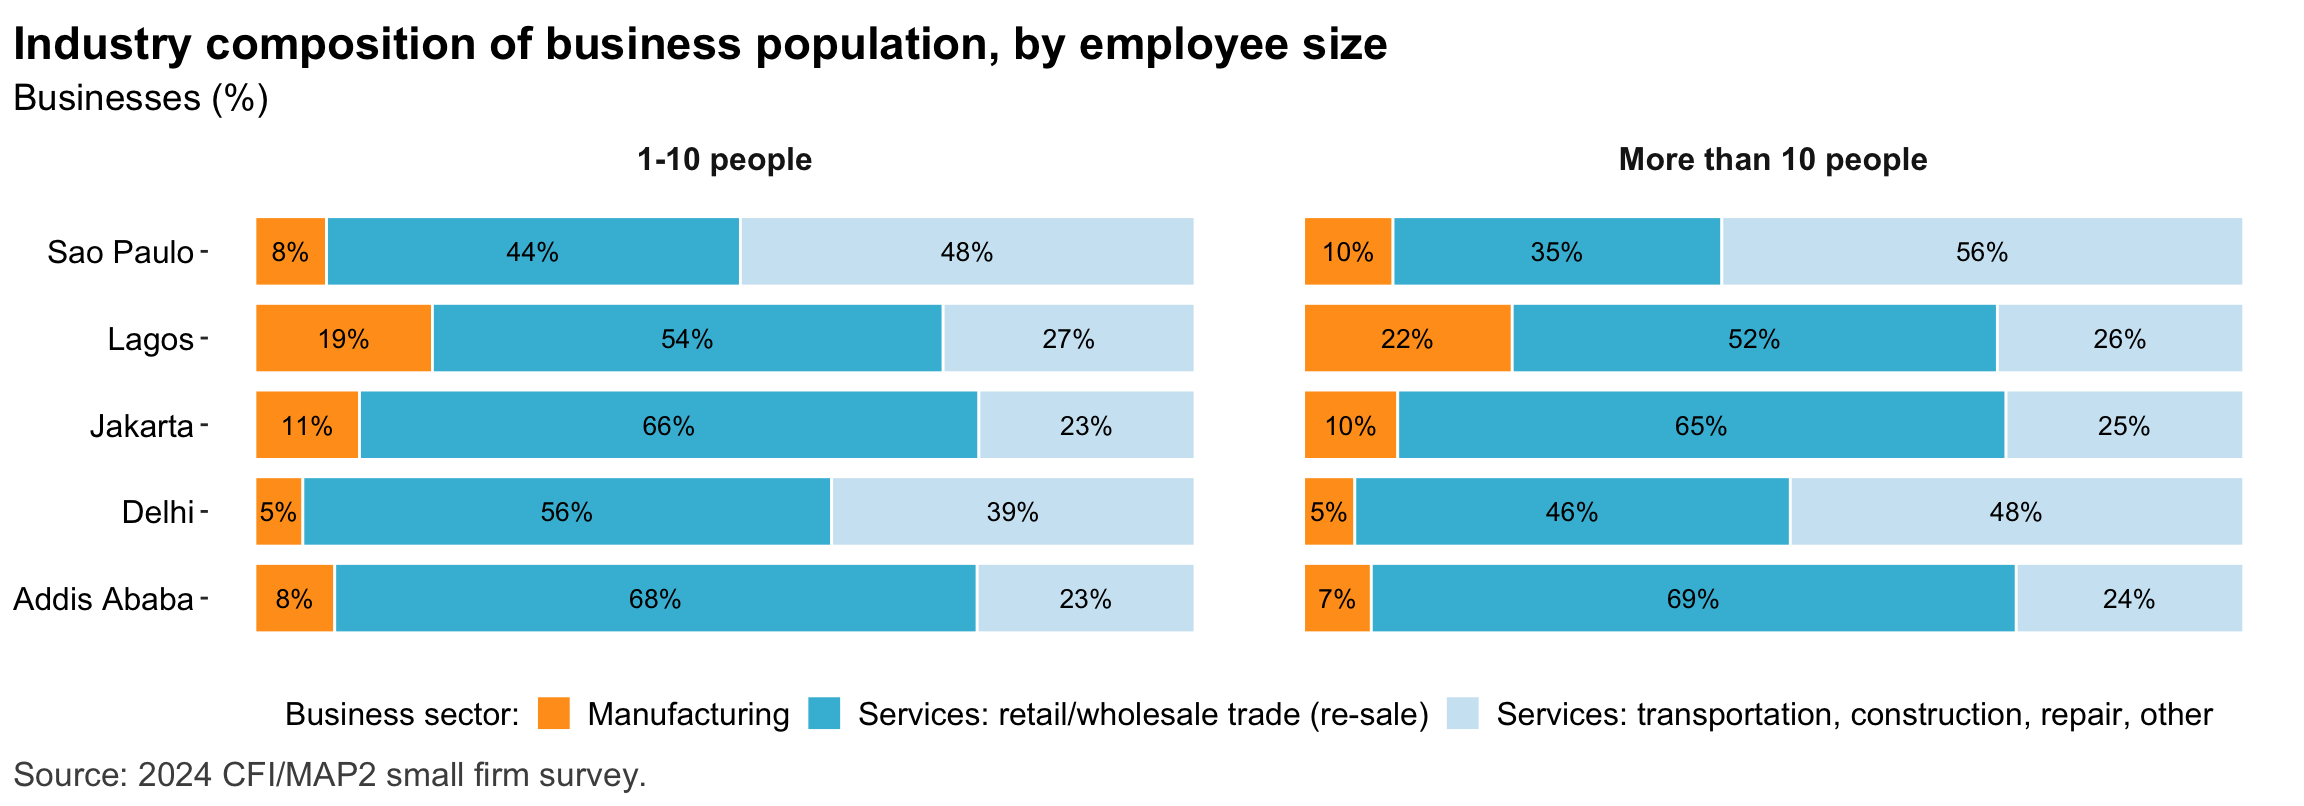
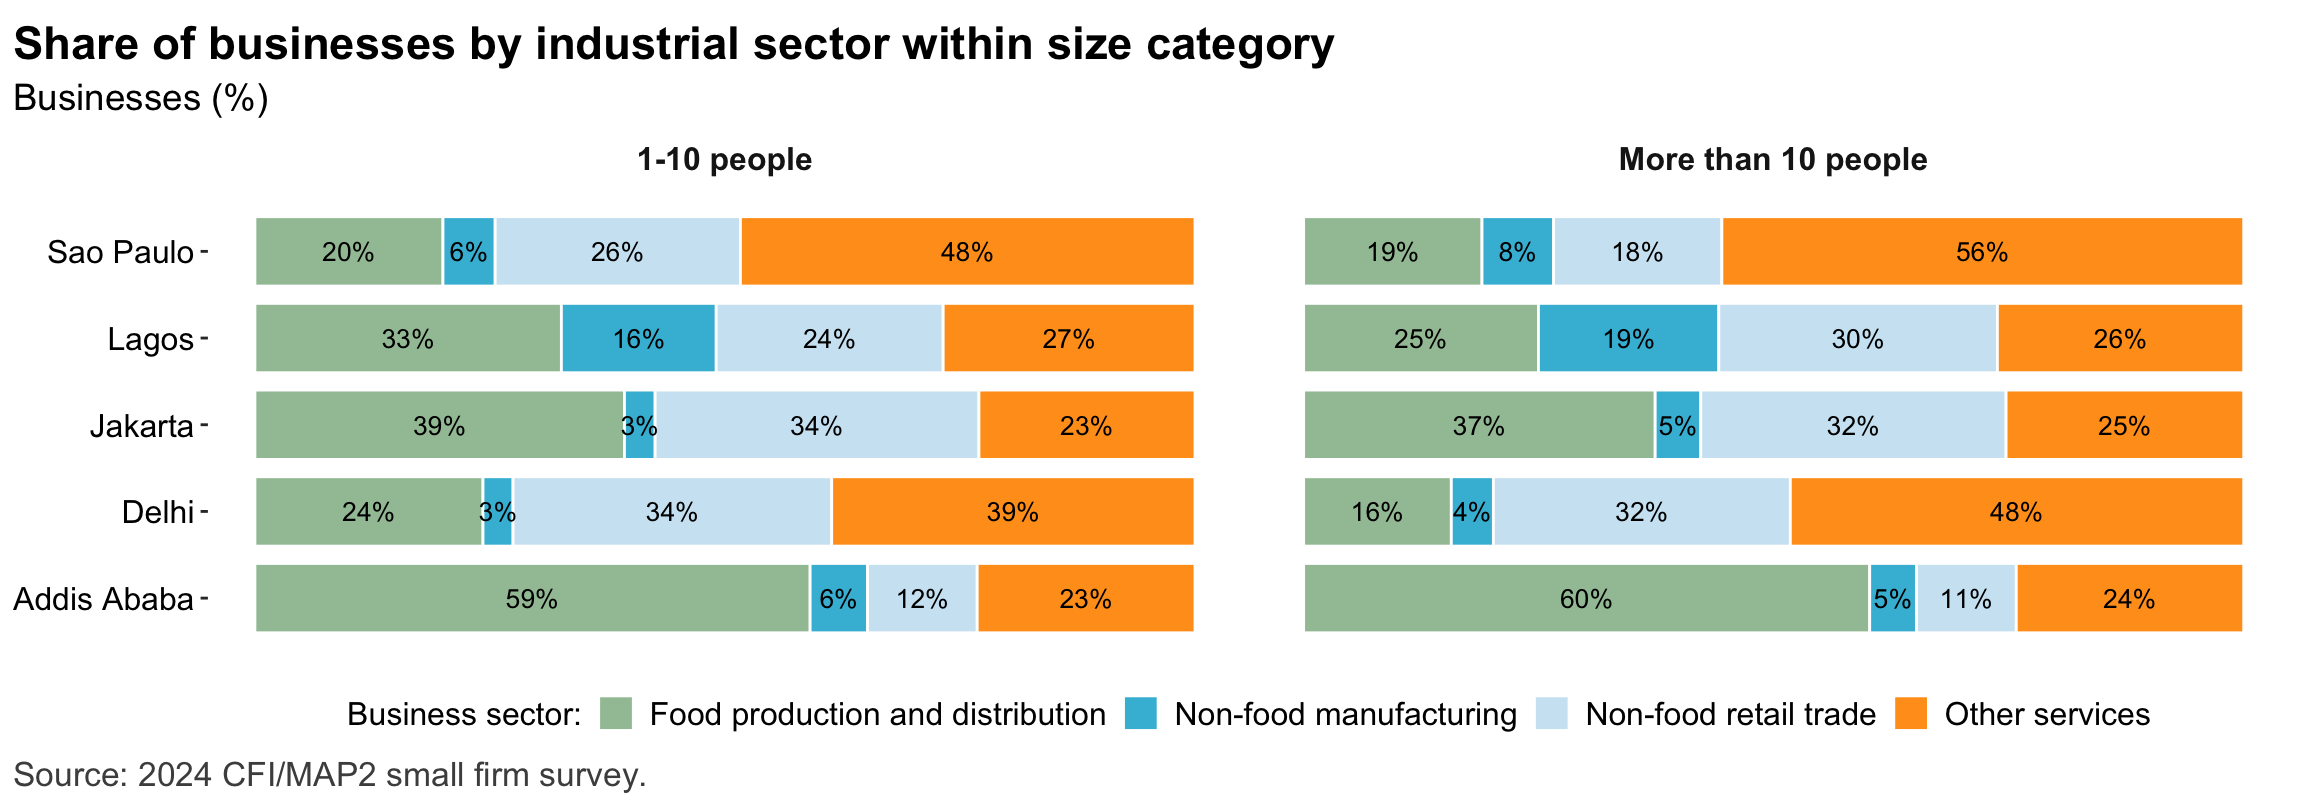
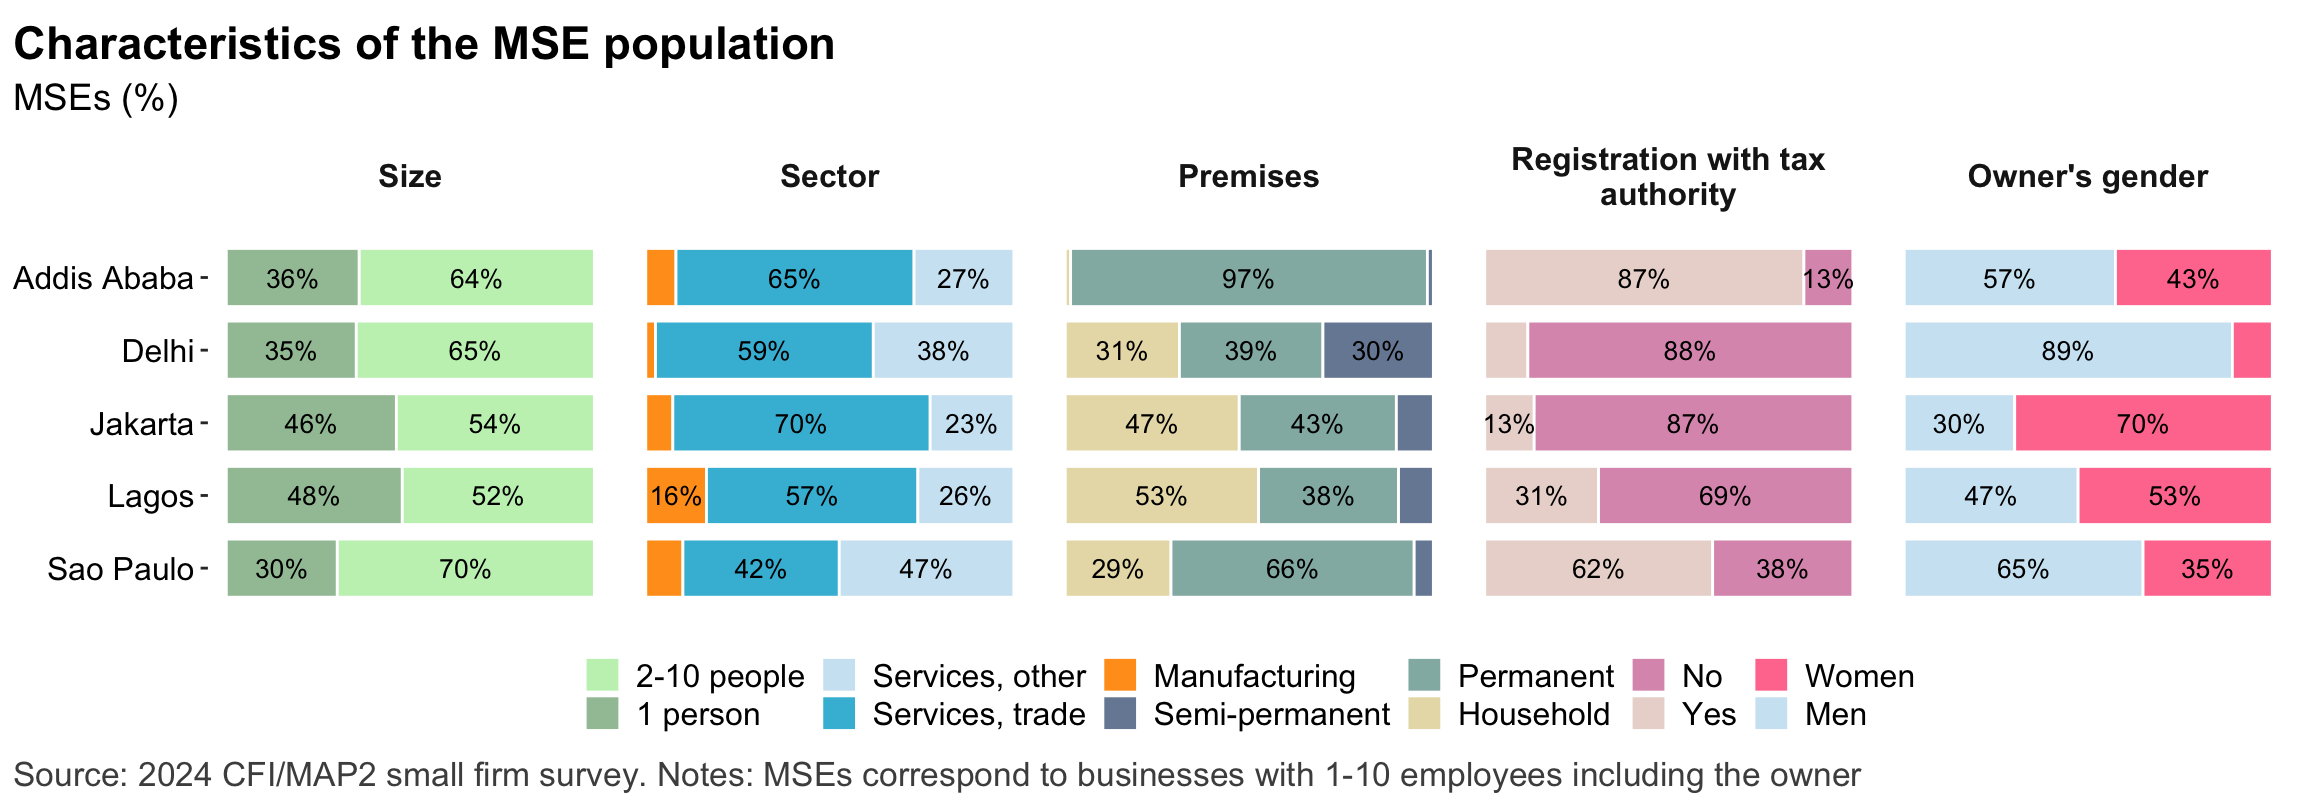
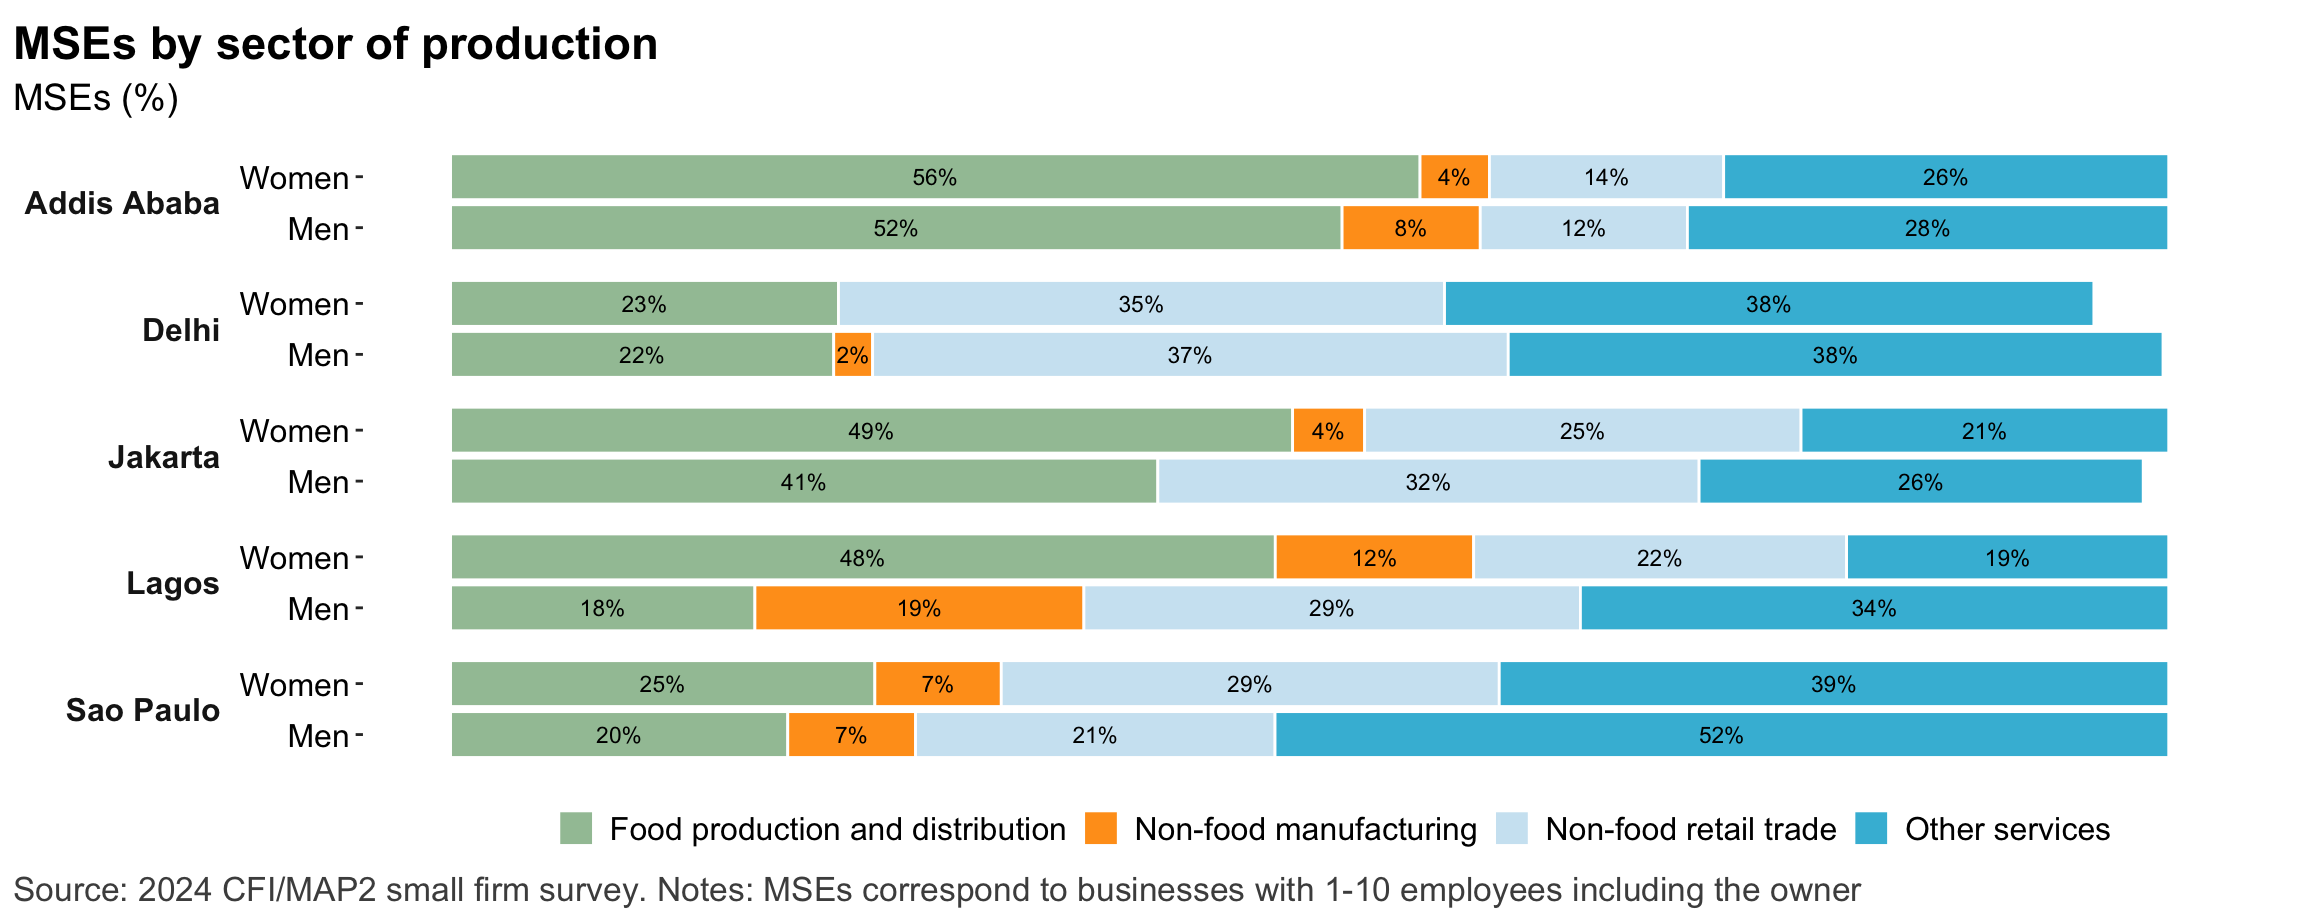
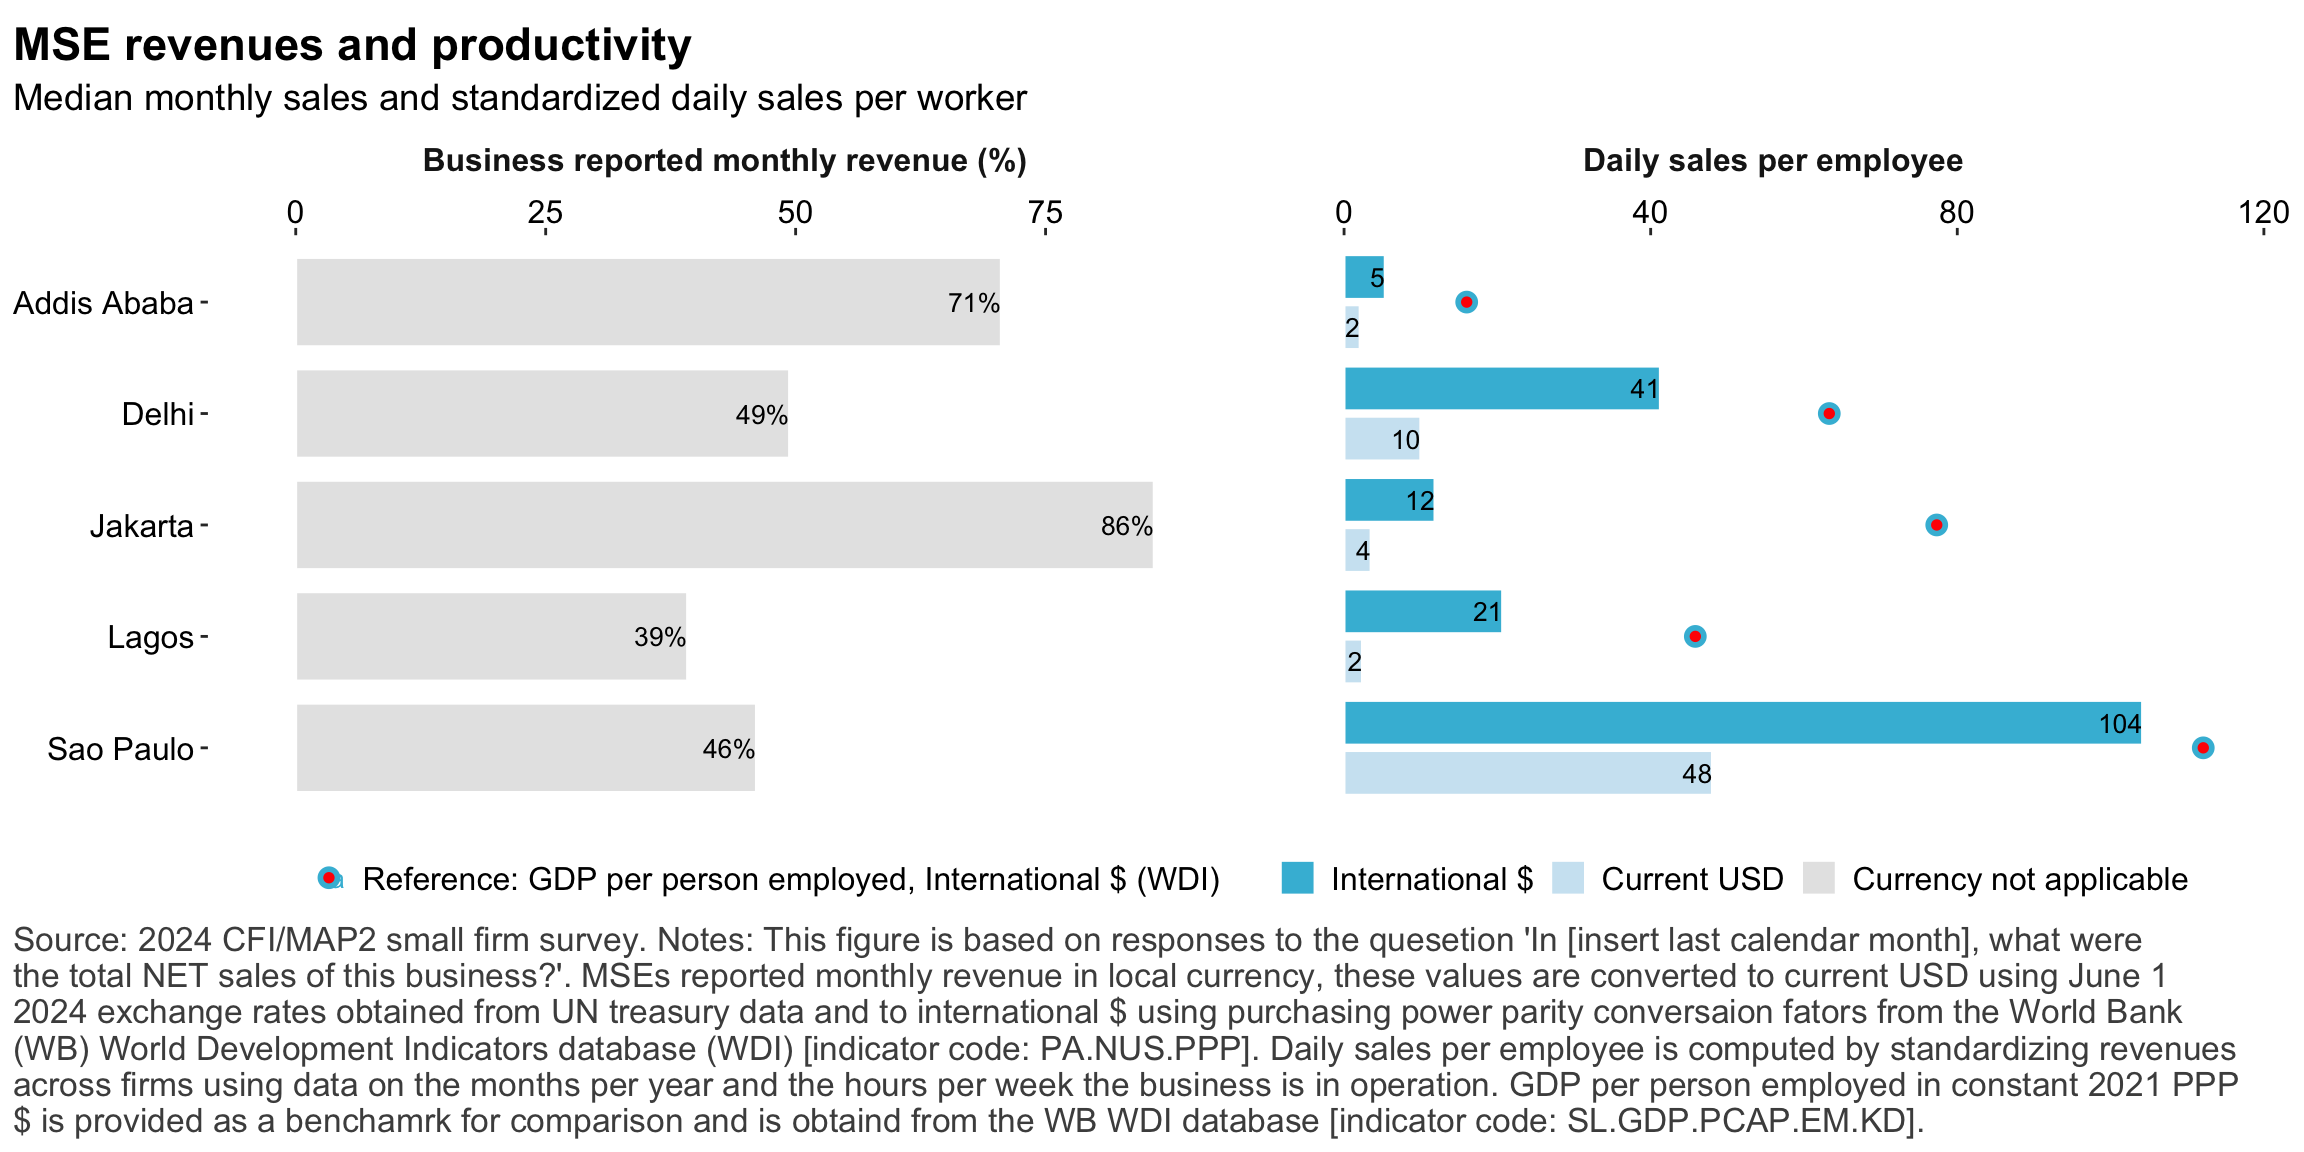
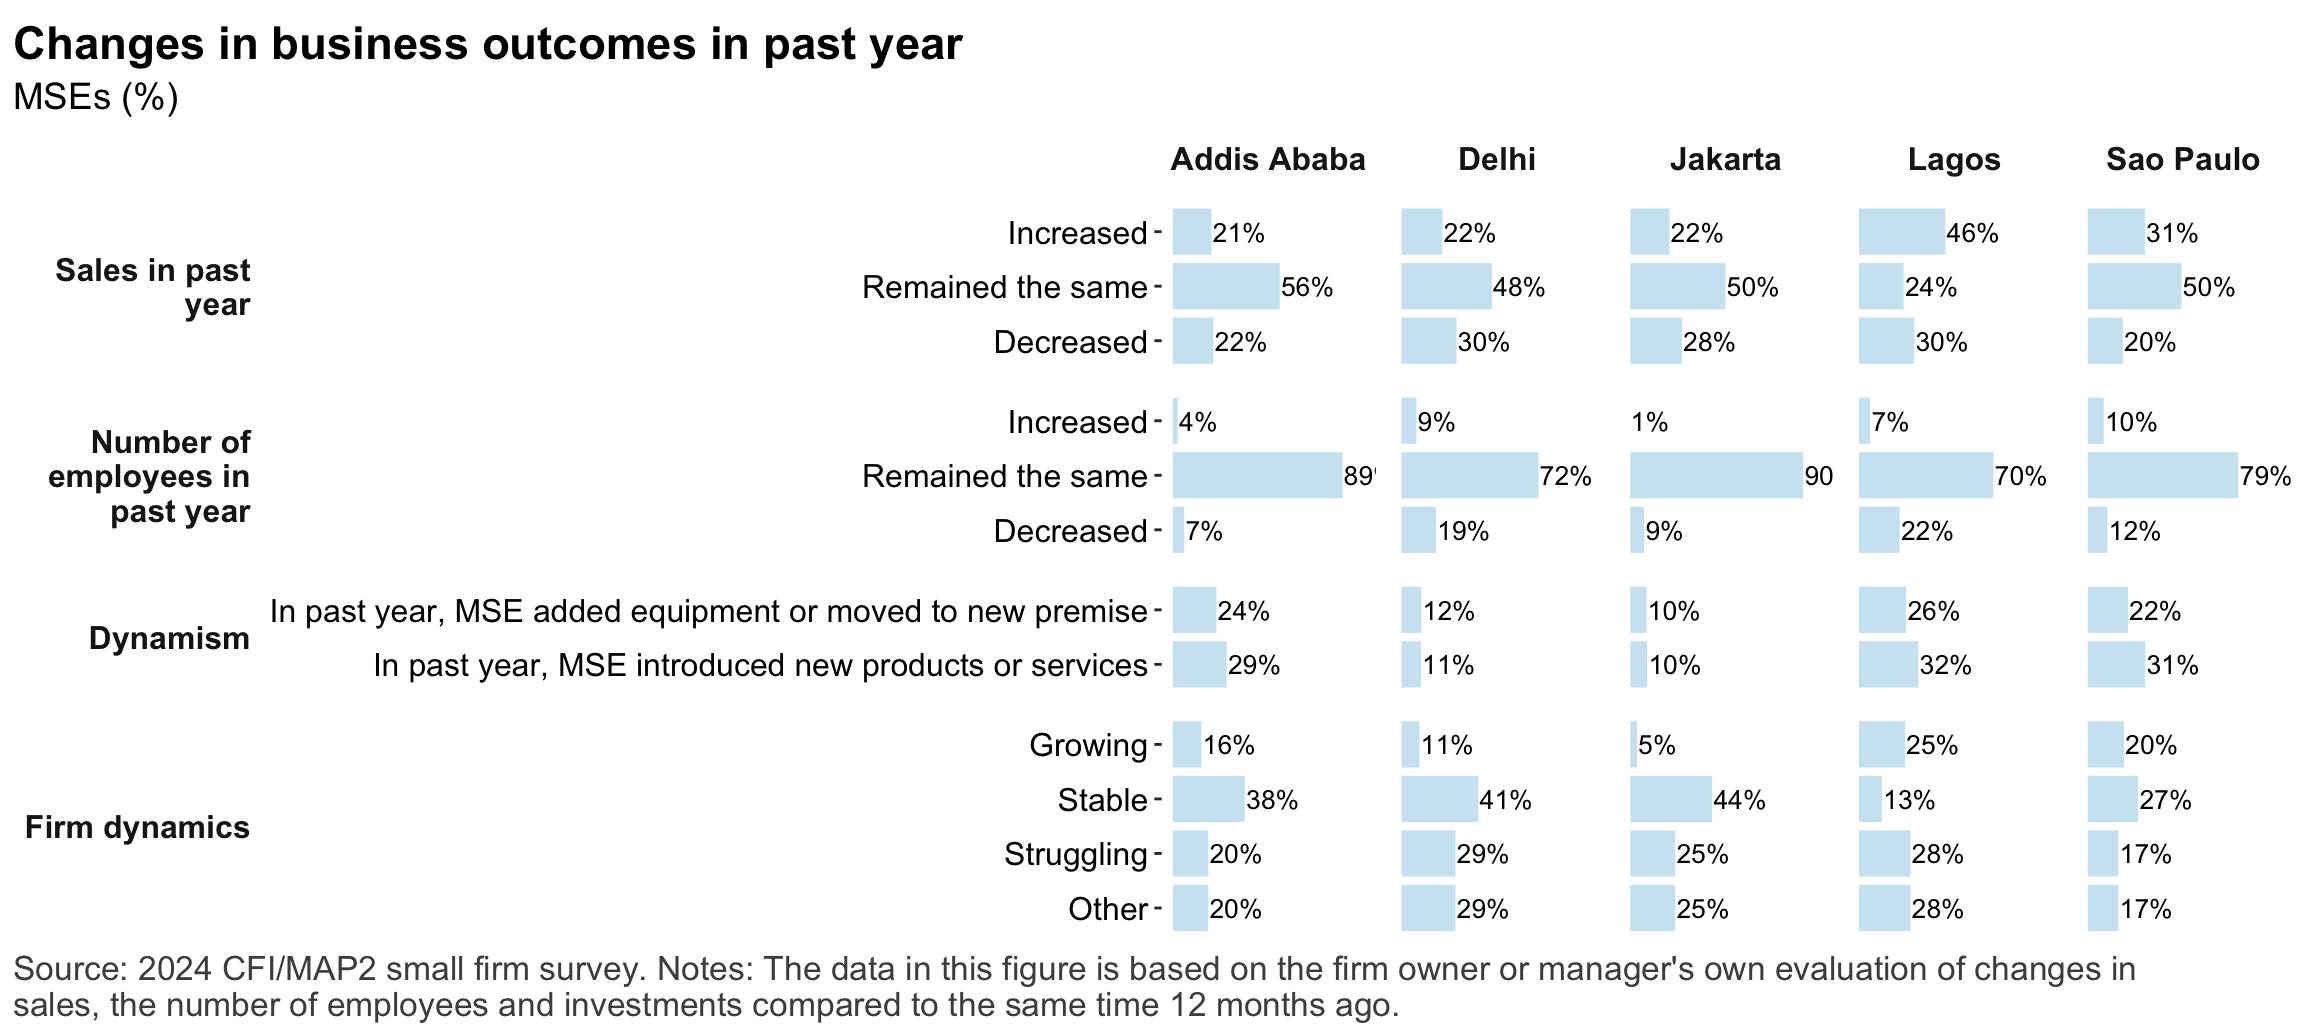
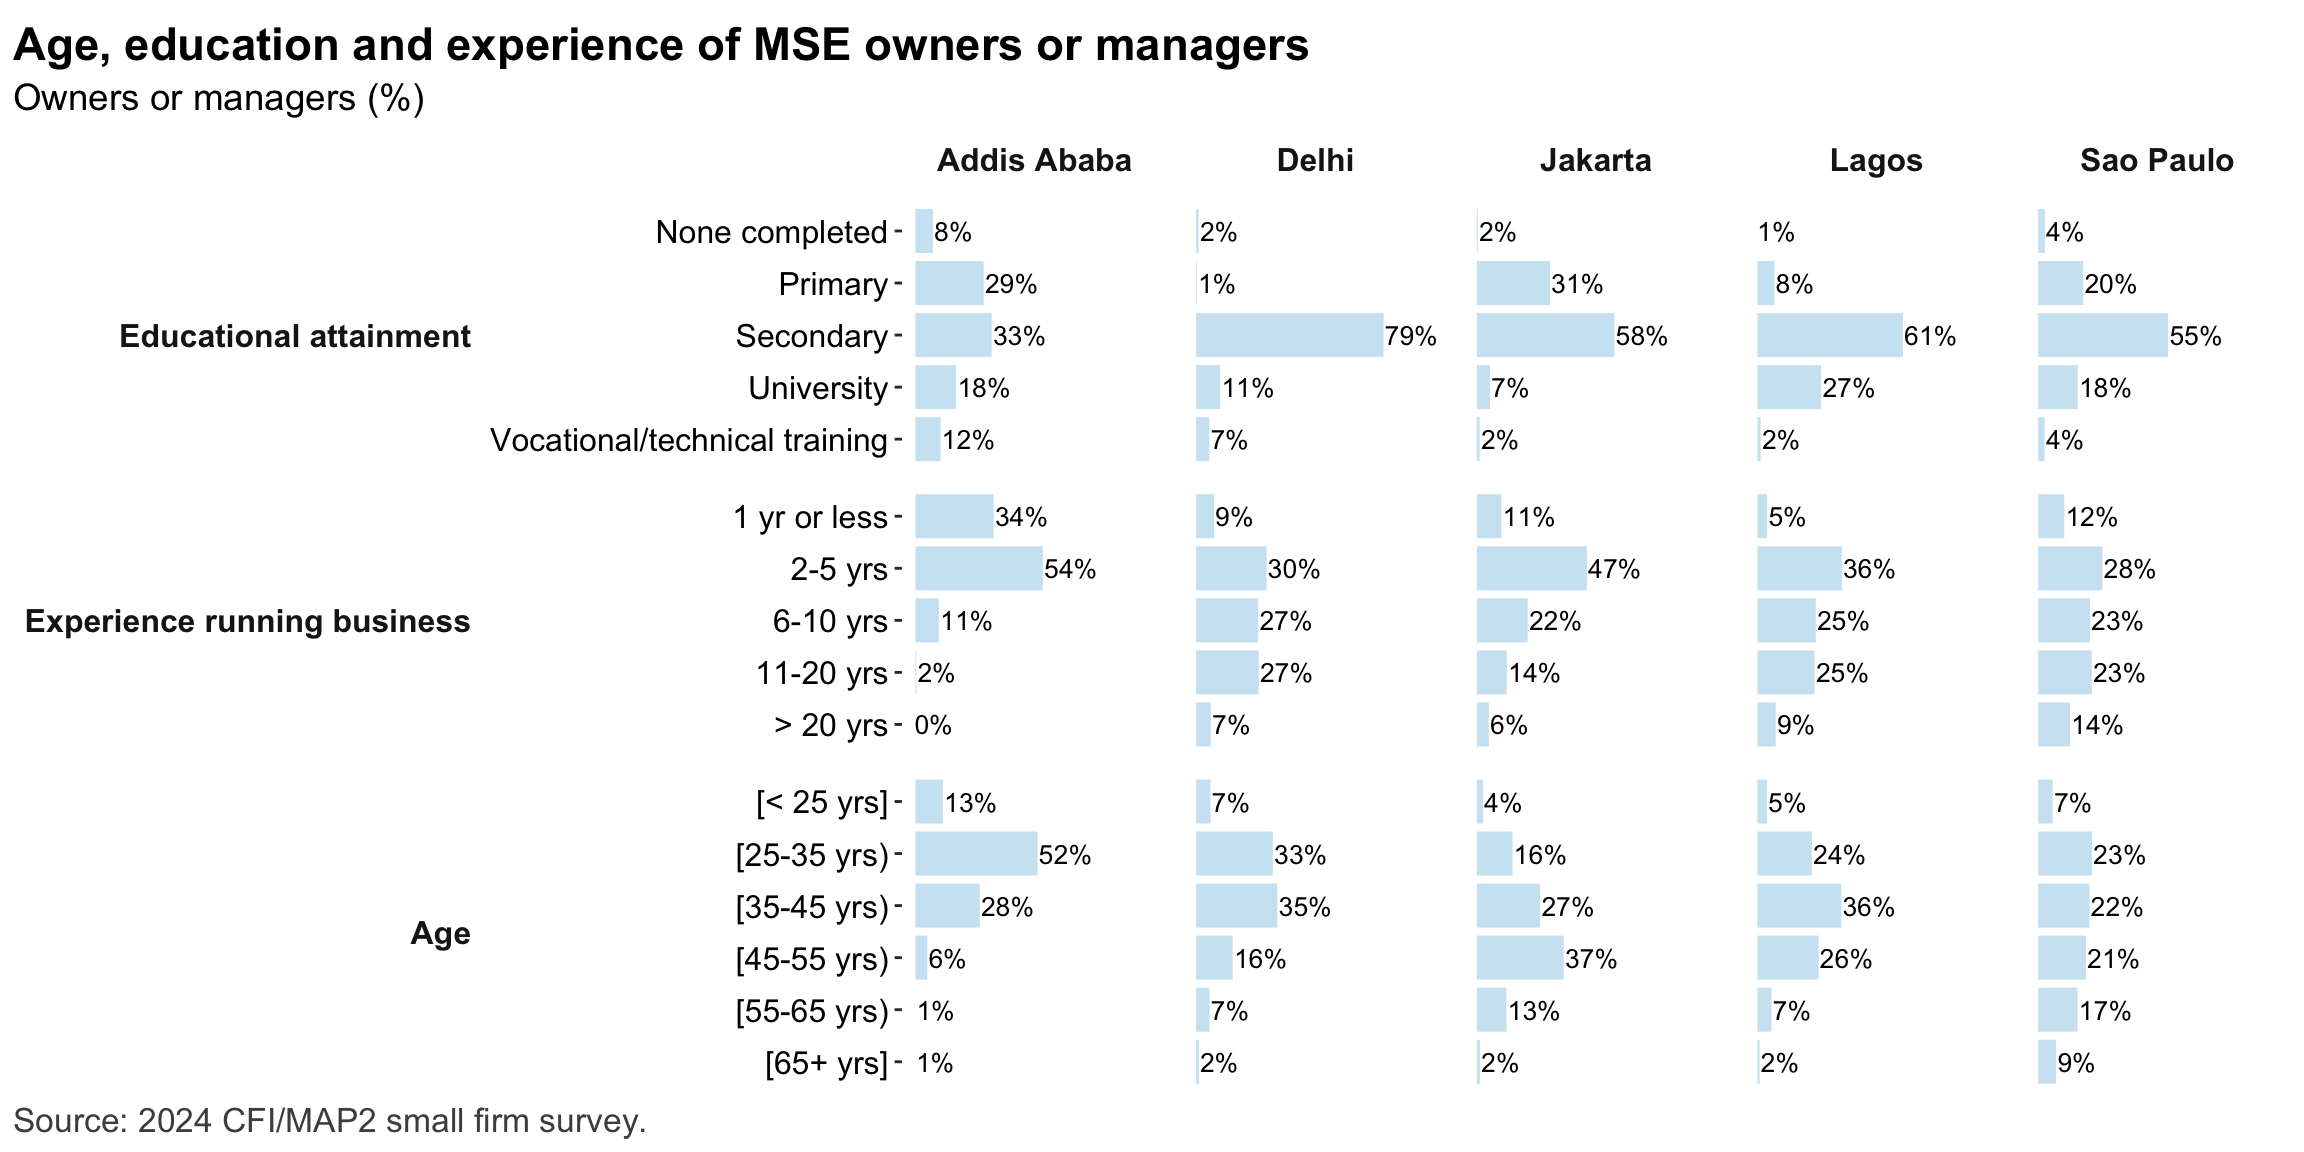
Figure 1: Businesses enumerated by sizeFigure 2: Businesses enumerated by sectorFigure 3: Businesses enumerated by sectorFigure 4: Sample characteristicsFigure 5: MSEs by sector of productionFigure 6: MSE revenues and productivityFigure 7: Changes in MSE outcomes in past yearFigure 8: MSE owner characteristicsFigure 9: Pyschographic characrteristics of SME owners or managers, by genderFigure 10: Pyschographic characrteristics of SME owners or managers, by genderFigure 11: Correlation between owner’s motivations, goals and attitudes to riskFigure 12: Summary measures of financial accessFigure 13: Access to connectivity and devicesFigure 14: Drivers of overall technology adoptionFigure 15: Applications of digital technologyFigure 16: Depth of digital technology adoptionFigure 17: Non-financial digital technology adoption factorsFigure 18: Relationship between internet-connectivity and firm-level labor productivityFigure 19: Relationship between digital technology and firm-level labor productivityFigure 20: Relationship between general digital technology adoption and subjective growthFigure 21: Relationship between digital technology adoption and firm-level labor productivityFigure 22: Relationship between digital technology adoption and firm-level labor productivityFigure 23: Relationship between depth of digital technology adoption and firm-level labor productivityFigure 24: Summary measures of financial accessFigure 25: Financical accounts and savingsFigure 26: Merchant paymentsFigure 27: Demand for creditFigure 28: Barriers to creditFigure 29: Impacts of digital financial servicesFigure 30: Insurance usageFigure 31: Relationship between financial services and firm-level labor productivityFigure 32: Relationship between financial services and financial resilienceFigure 33: Relationship between financial services and firm growthFigure 34: Relationship between financial services and capital investmentFigure 35: Challenges with loan repaymentFigure 36: Consumer protection issuesFigure 37: Consumer protection issuesFigure 38: Predictors of consumer protection risks: DemographicsFigure 39: Predictors of exposure to consumer risks: Breadth of digital technologiesFigure 40: Predictors of exposure to consumer risks: Non-financial digital technologiesFigure 41: Predictors of exposure to consumer risks: Financial servicesFigure 42: Relationship between depth of digital technology adoption and exposure to consumer protection risksFigure 43: Risks: GeneralFigure 44: Risks: ClimateFigure 45: Risks: ImpactsFigure 46: Financial resilienceFigure 47: Non-financial dimensions of business resilienceFigure 48: Access to connectivity and devicesFigure 49: Relationship between prior exposure to weather shock and investment in adaptationFigure 50: Relationship between prior exposure to weather shock and use of financial servicesFigure 51: Relationship between prior exposure to weather shock and use of digital toolsFigure 52: Relationship between overall technology adoption & resilienceFigure 53: MSEs by premises typeFigure 54: MSES by sector